3523. Enabling Tomcat Debugging in Docker for EclipseDocker, Debugging, Eclipse, and Tomcat
Tutorial for how to setup remote debugging in Eclipse for tomcat in Docker.
1. Introduction
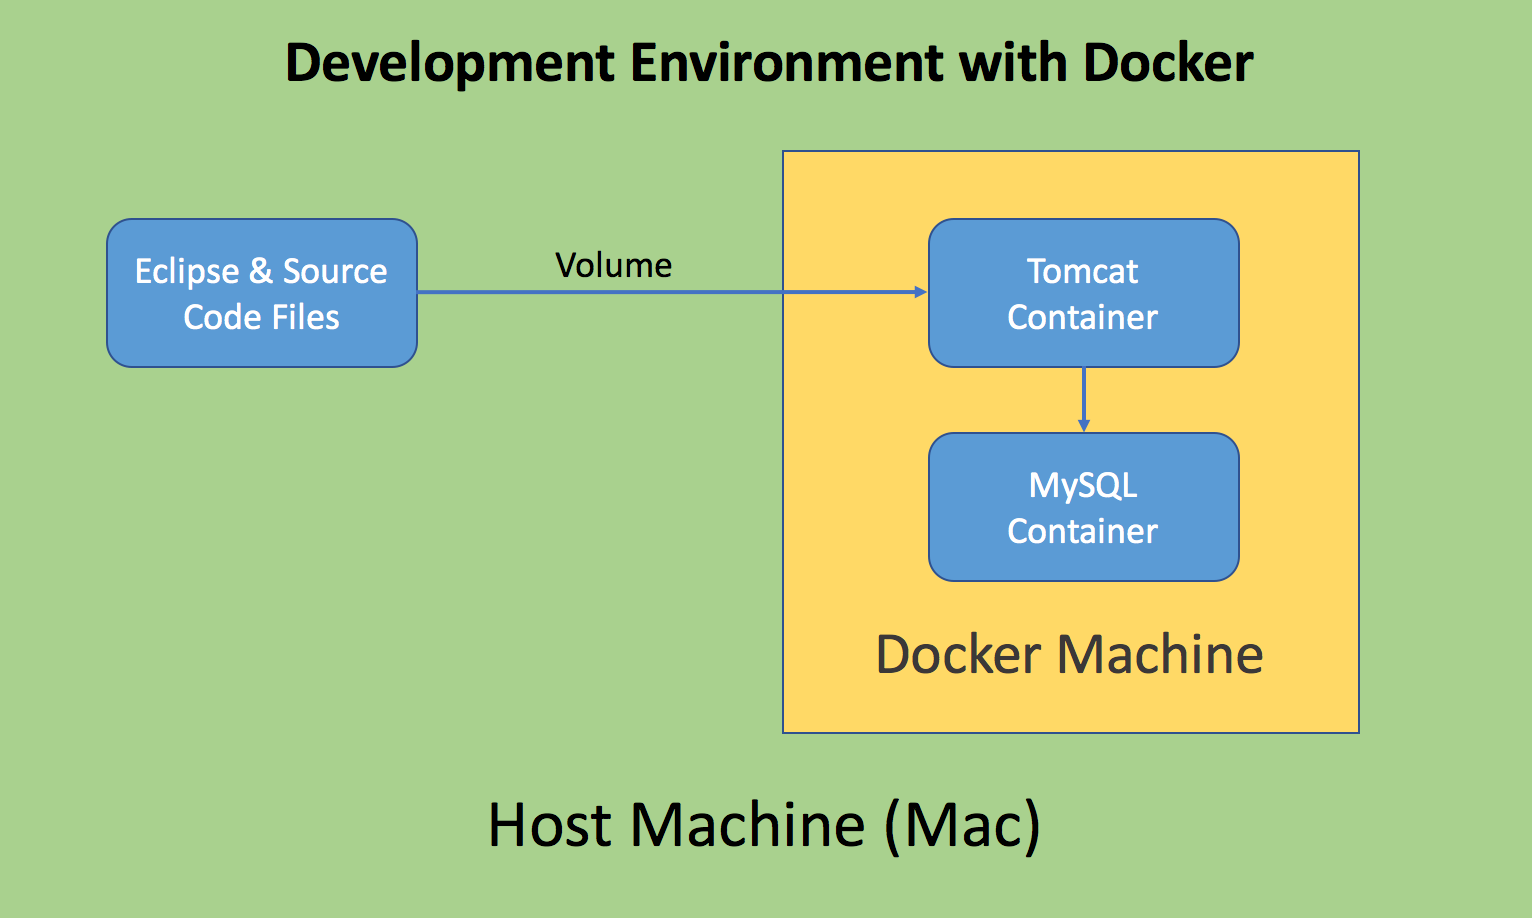
In posting Serving JSP Application With Tomcat In Docker, we deployed the JSP Tutorial application to Tomcat container. Be aware of the following facts:
- Source files are located on host machine, and copied to tomcat webapps folder through volume.
- The JSP Tutorial application is served in Tomcat container.
- Data is persisted into the MySQL container.
- Tomcat container connects MySQL container to read/write data. They are hosted in the same docker machine with same IP address but different ports.
Now, one question is how to debug this JSP application? Actually, Tomcat supports remote debugging, the following steps introduce how to enable debugging in Eclipse.
2. Setting up Tomcat Container
2.1 Remote Debugging in Tomcat
In general, tomcat can be configured to allow a program such as eclipse to connect remotely using JPDA and see debugging information. To configure tomcat to allow remote debugging, start tomcat using the catalina startup script (from your tomcat home) instead of the normal startup script like so (tomcat must be stopped before you can change over):
$ export JPDA_ADDRESS=8000
$ export JPDA_TRANSPORT=dt_socket
$ bin/catalina.sh jpda run
2.2 Creating Tomcat Container with Enabling Remote Debugging
Manually create Tomcat container with Remote Debugging enabled. In docker terminal, run the following command.
$ docker run --name=jsptomcatdebug -d -v ~/Documents/jsptomcat:/usr/local/tomcat/webapps/jsptutorial -p 31020:8080 -p 8000:8000 -e JPDA_ADDRESS=8000 tomcat catalina.sh jpda run
Compare with the similar command used in the last posting, we append -p 8000:8000 -e JPDA_ADDRESS=8000 tomcat catalina.sh jpda run to the end.
Let’s take a moment to examine this command in detail:
- –name=jsptomcatdebug names the container so we can refer to it more easily.
- -d detaches the process and runs in the background. Otherwise, we would just be watching an empty Tomcat prompt and wouldn’t be able to use this terminal until we killed Tomcat.
- -v ~/Documents/jsptomcat:/usr/local/tomcat/webapps/jsptutorial Sets up a bindmount volume that links the /usr/local/tomcat/webapps/jsptutorial directory from inside the Tomcat container to the ~/Documents/jsptomcat directory on the host machine. Docker uses a : to split the host’s path from the container path, and the host path always comes first.
- -p 31020:8080 sets up a port forward. The Tomcat container is listening on port 8080 by default. This flag maps the container’s port 8080 to port 31020 on the host system.
- tomcat specifies that the container should be built from the tomcat image
- -p 8000:8000 sets up another port for debugging purpose. So Eclipse can connect to tomcat container to get debugging information through this port.
- -e JPDA_ADDRESS=8000 setups the environment variable, just like executing ‘export JPDA_ADDRESS=8000’ in terminal.
- catalina.sh jpda run, tells the container to launch tomcat with this command.
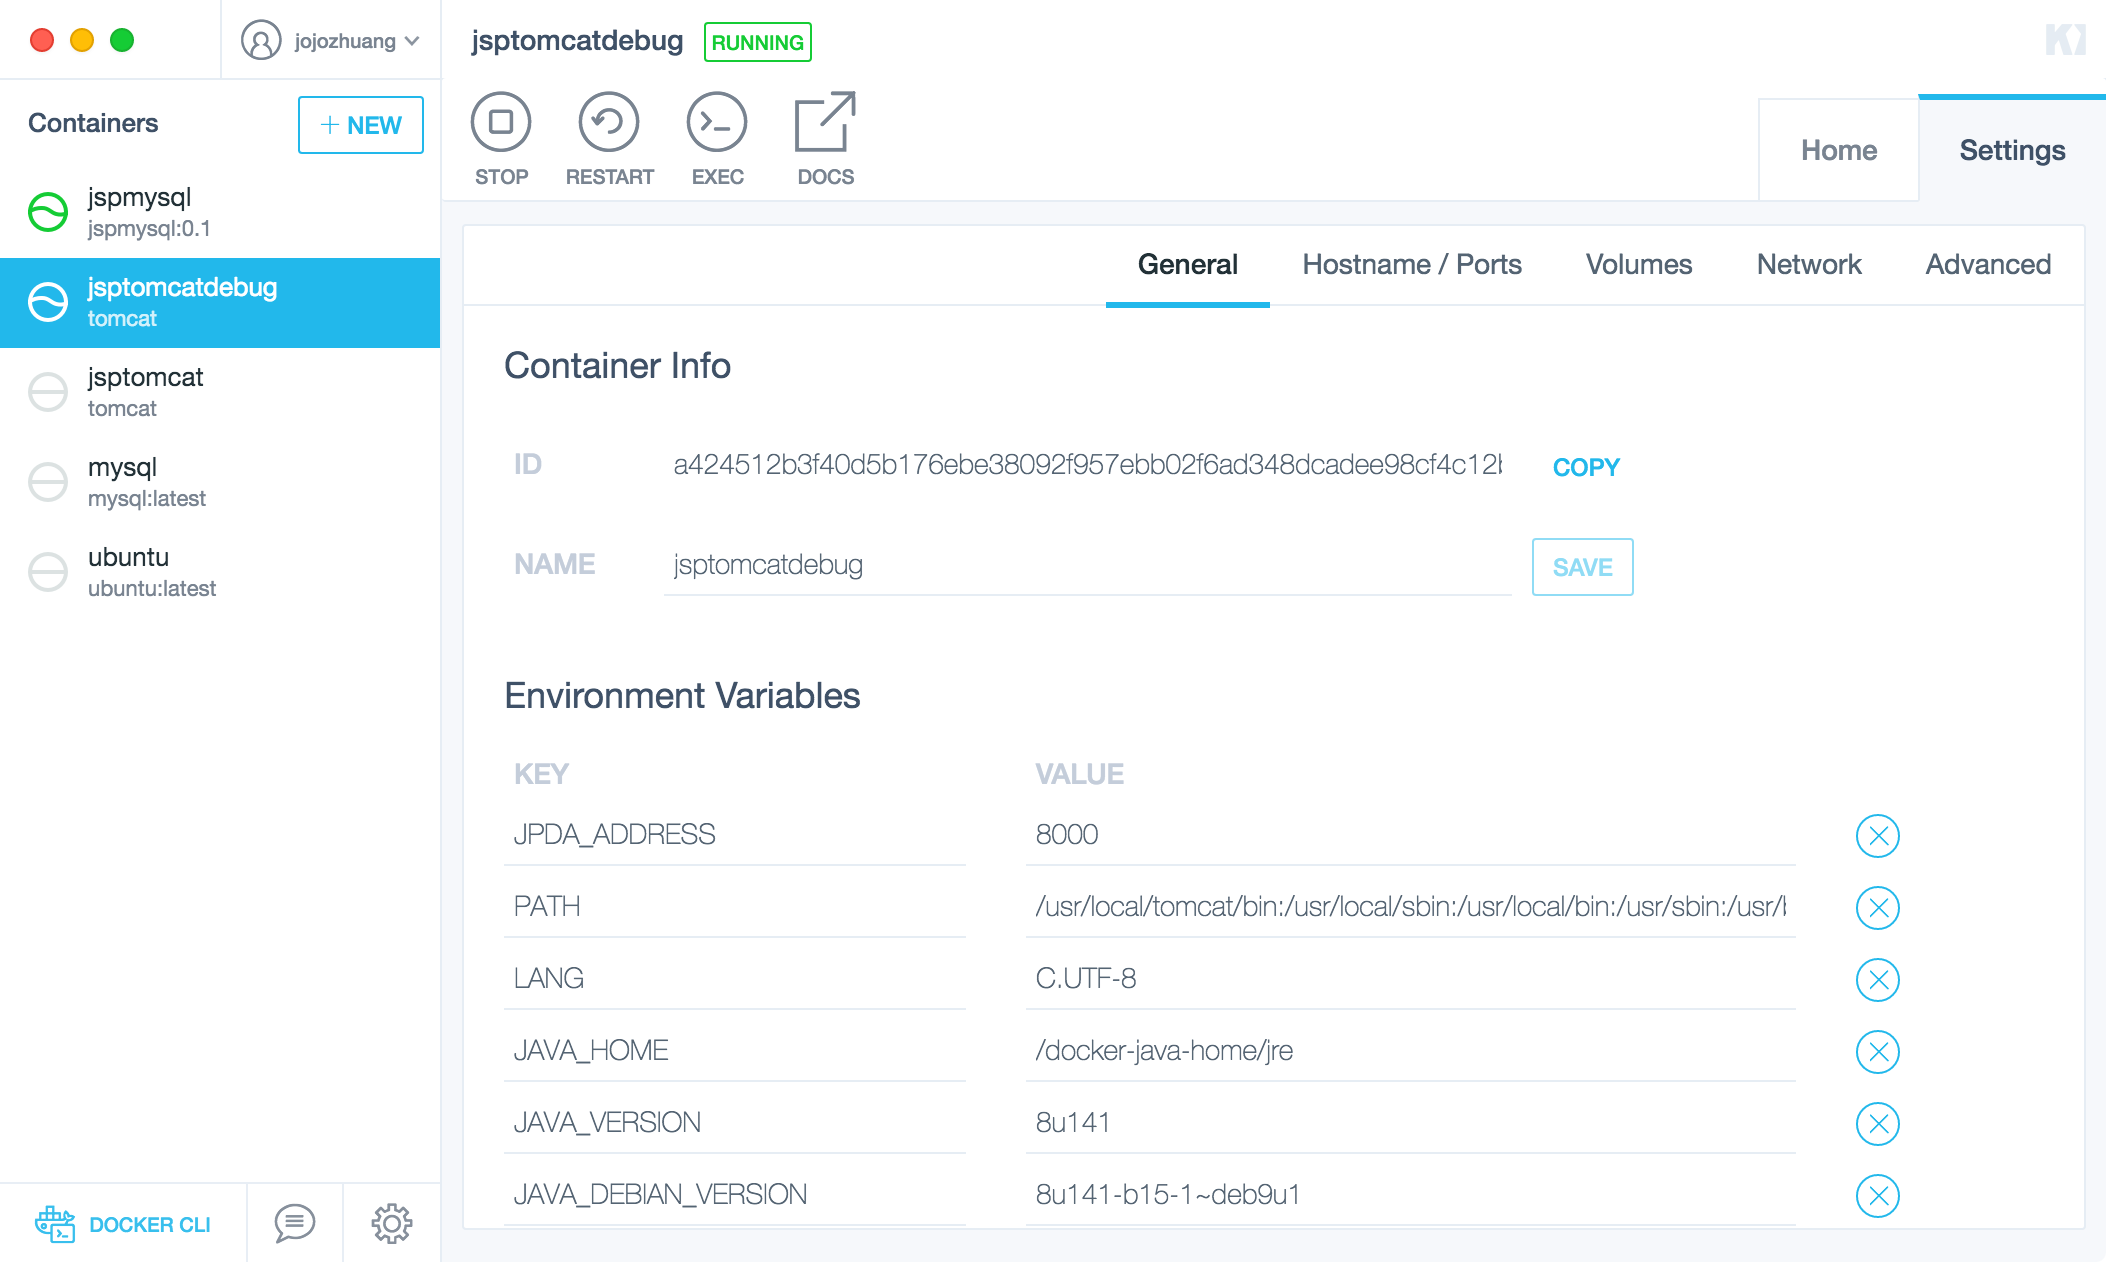
Switch to Kitematic, the new container is running with JPDA_ADDRESS configured to 8000.
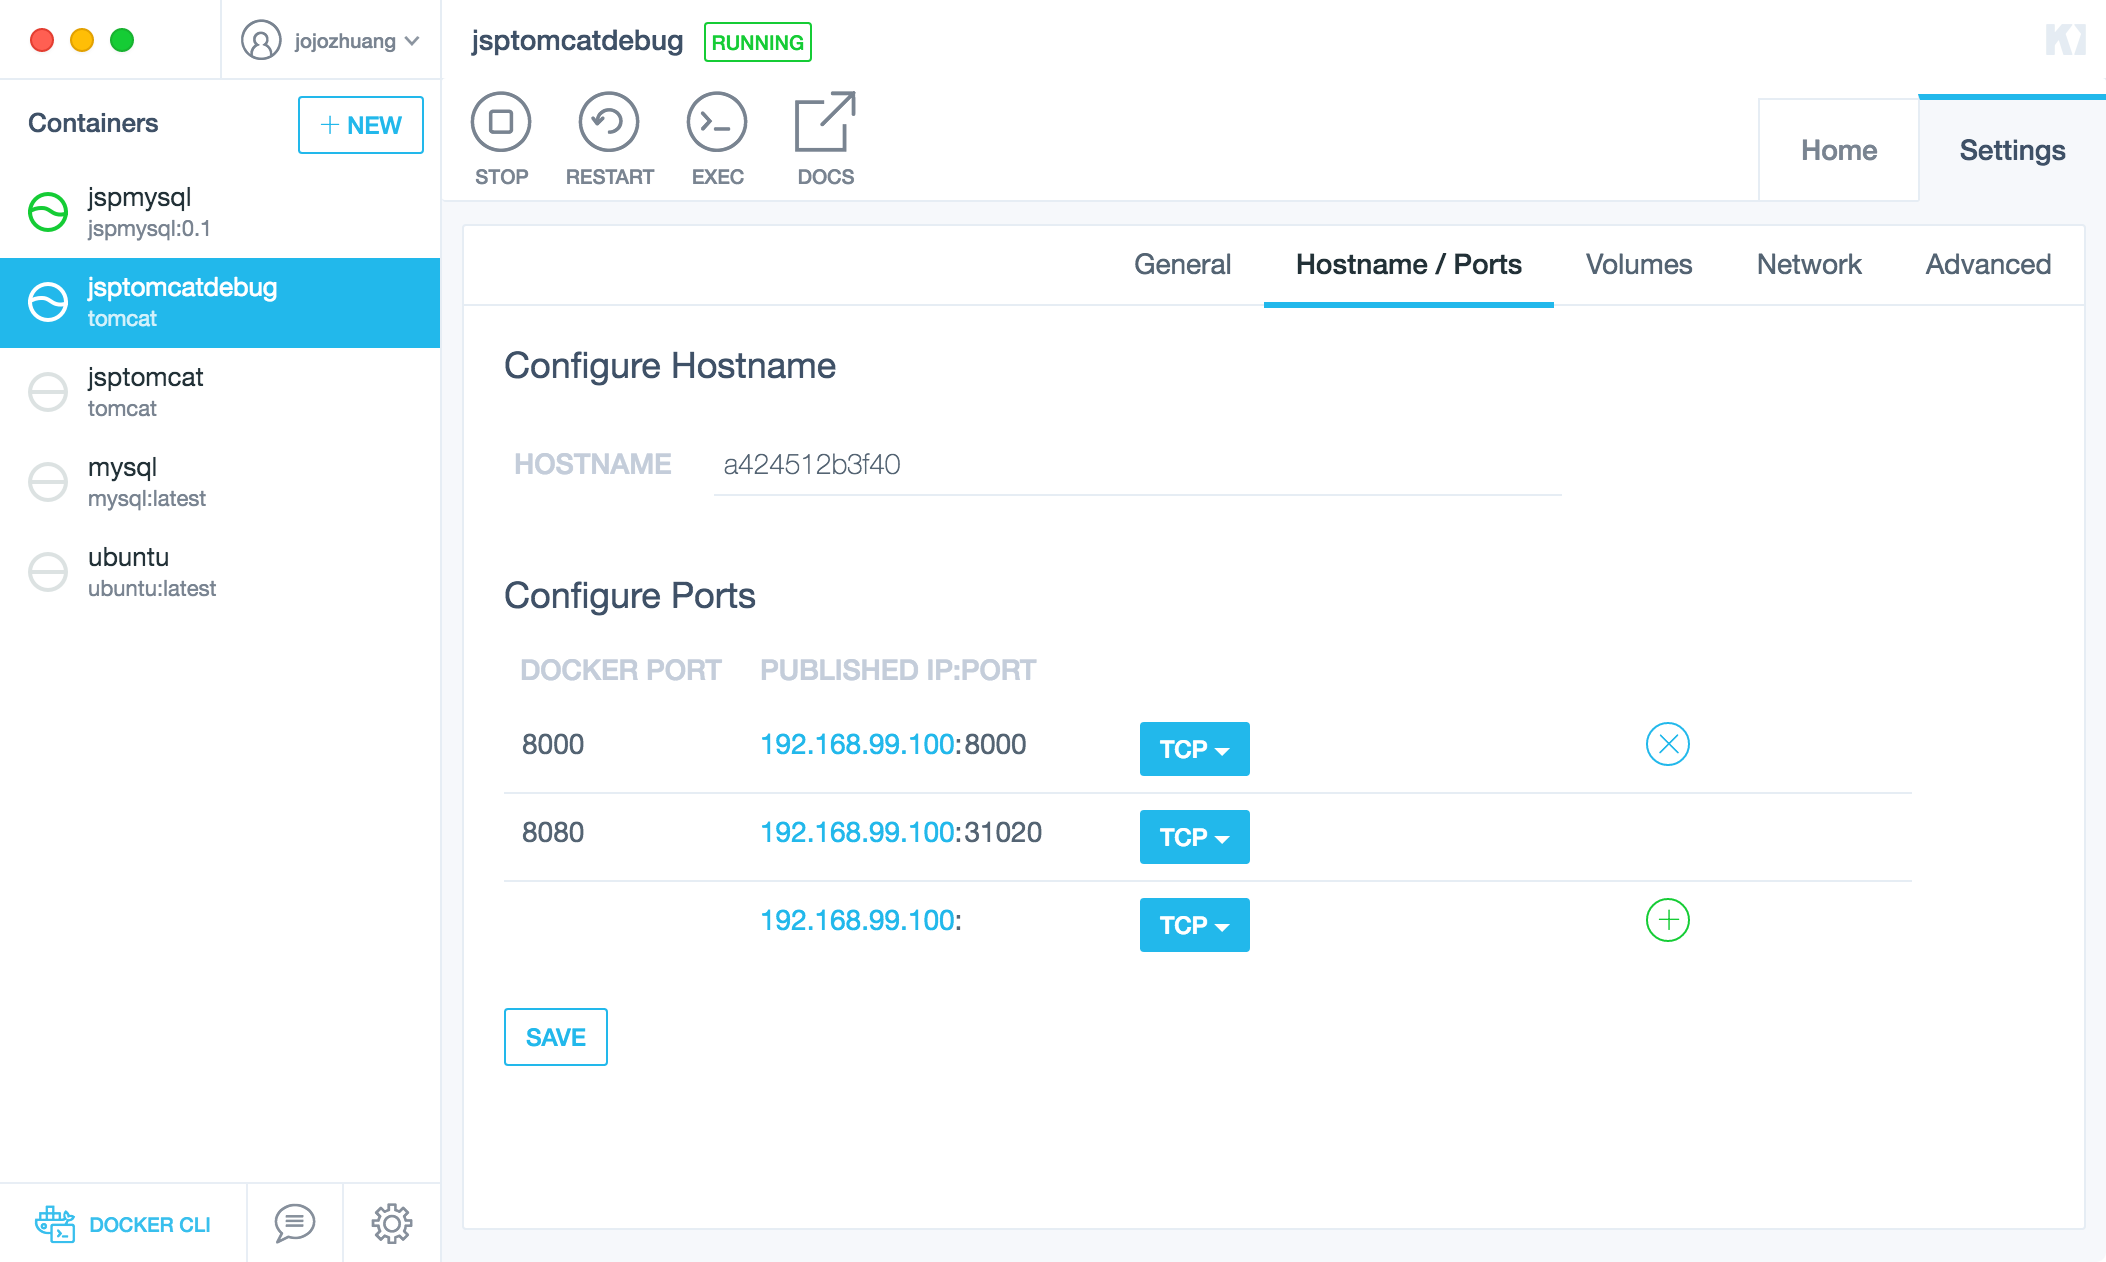
Apart from port 31020, port 8000 for debugging is exposed to host machine as well.
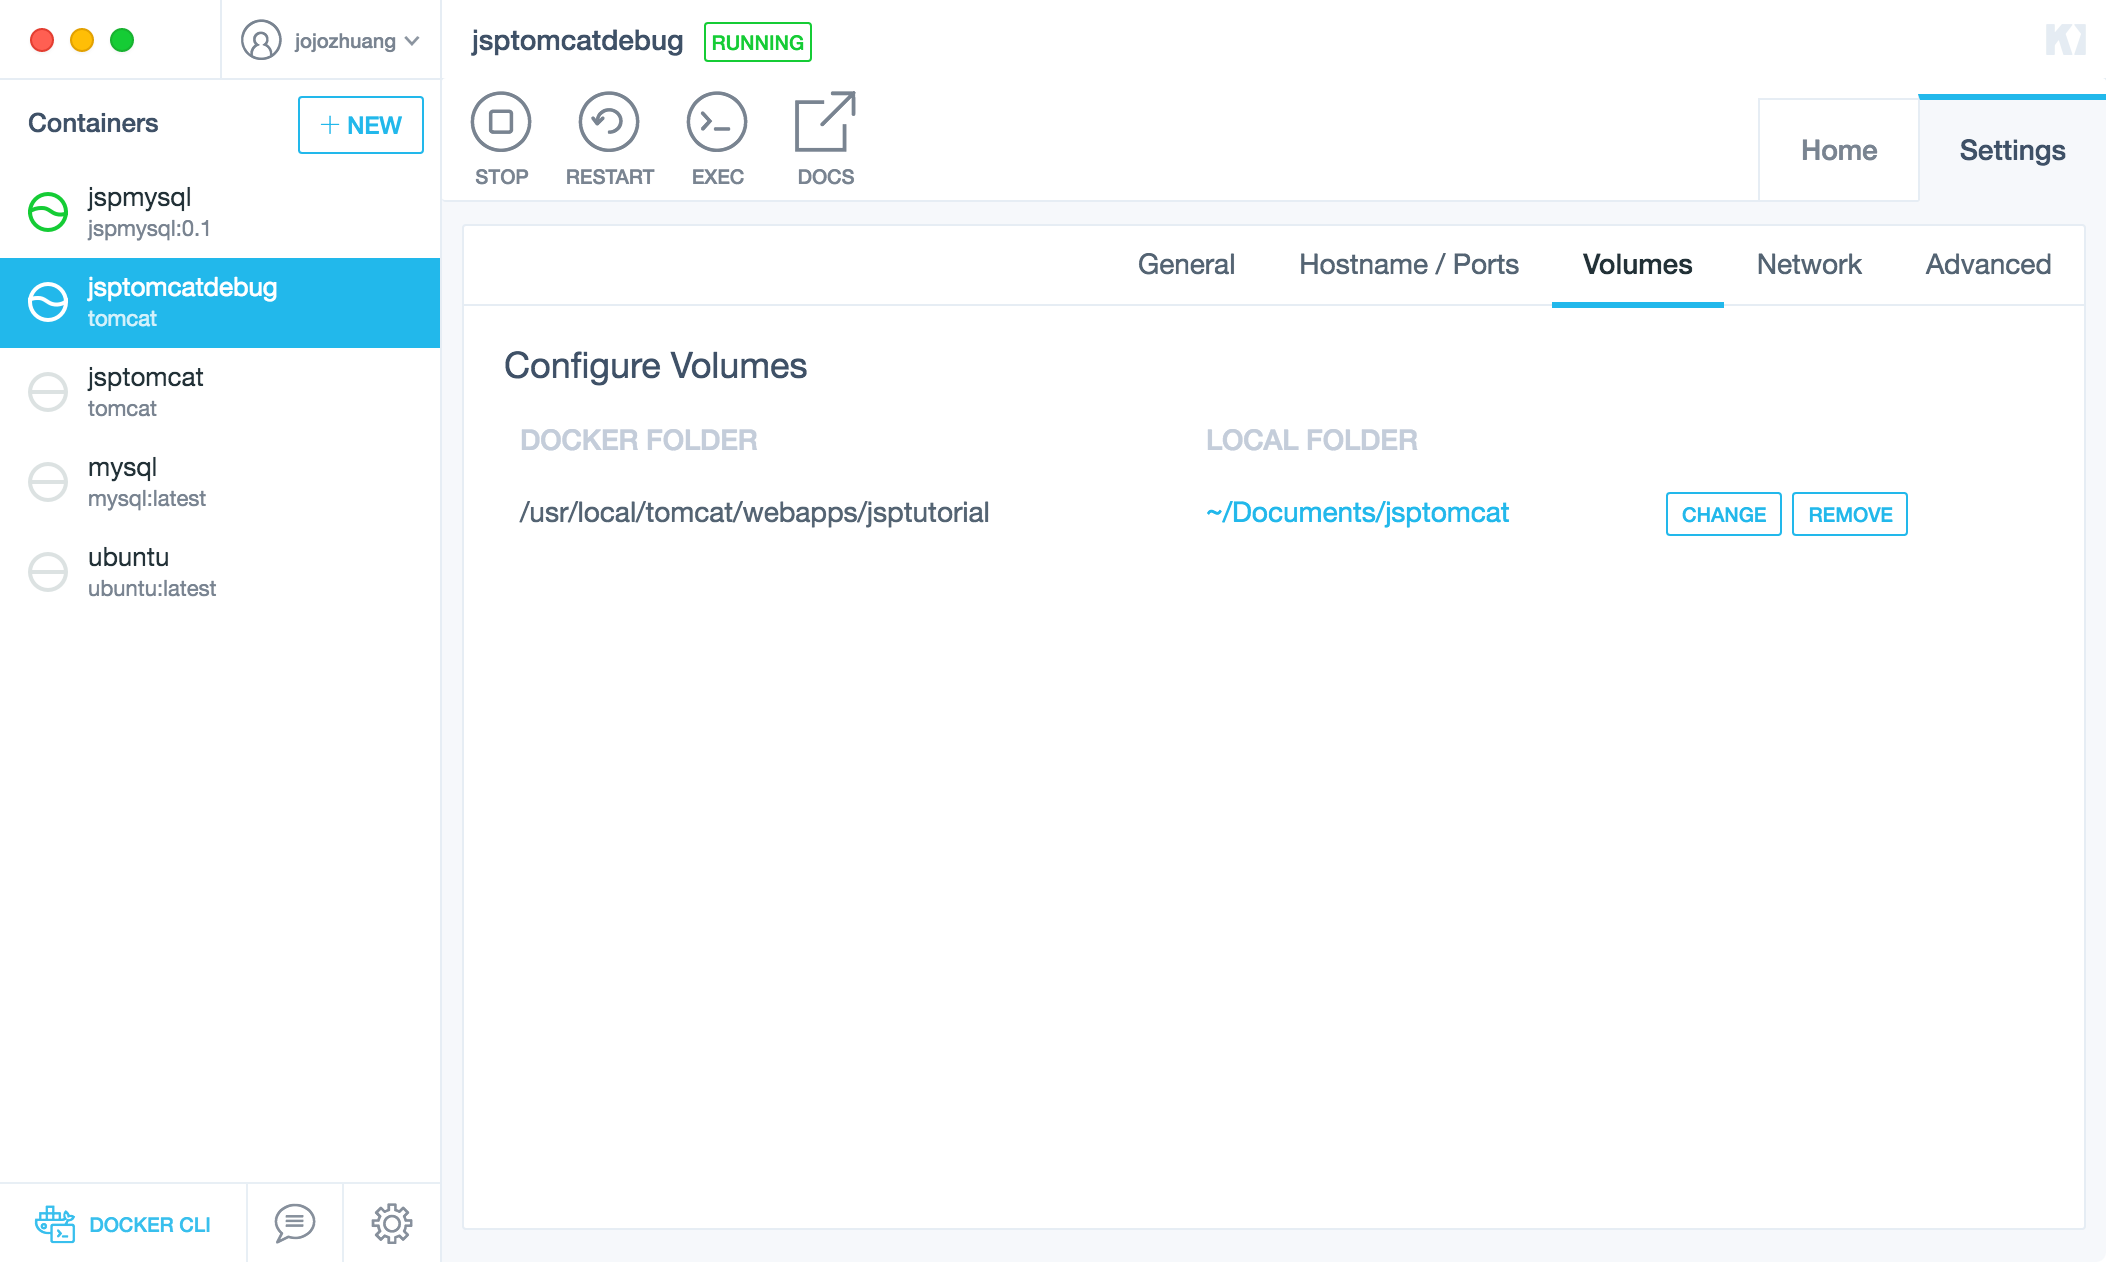
Use the same ~/Documents/jsptomcat folder, which we deployed JSP application into.
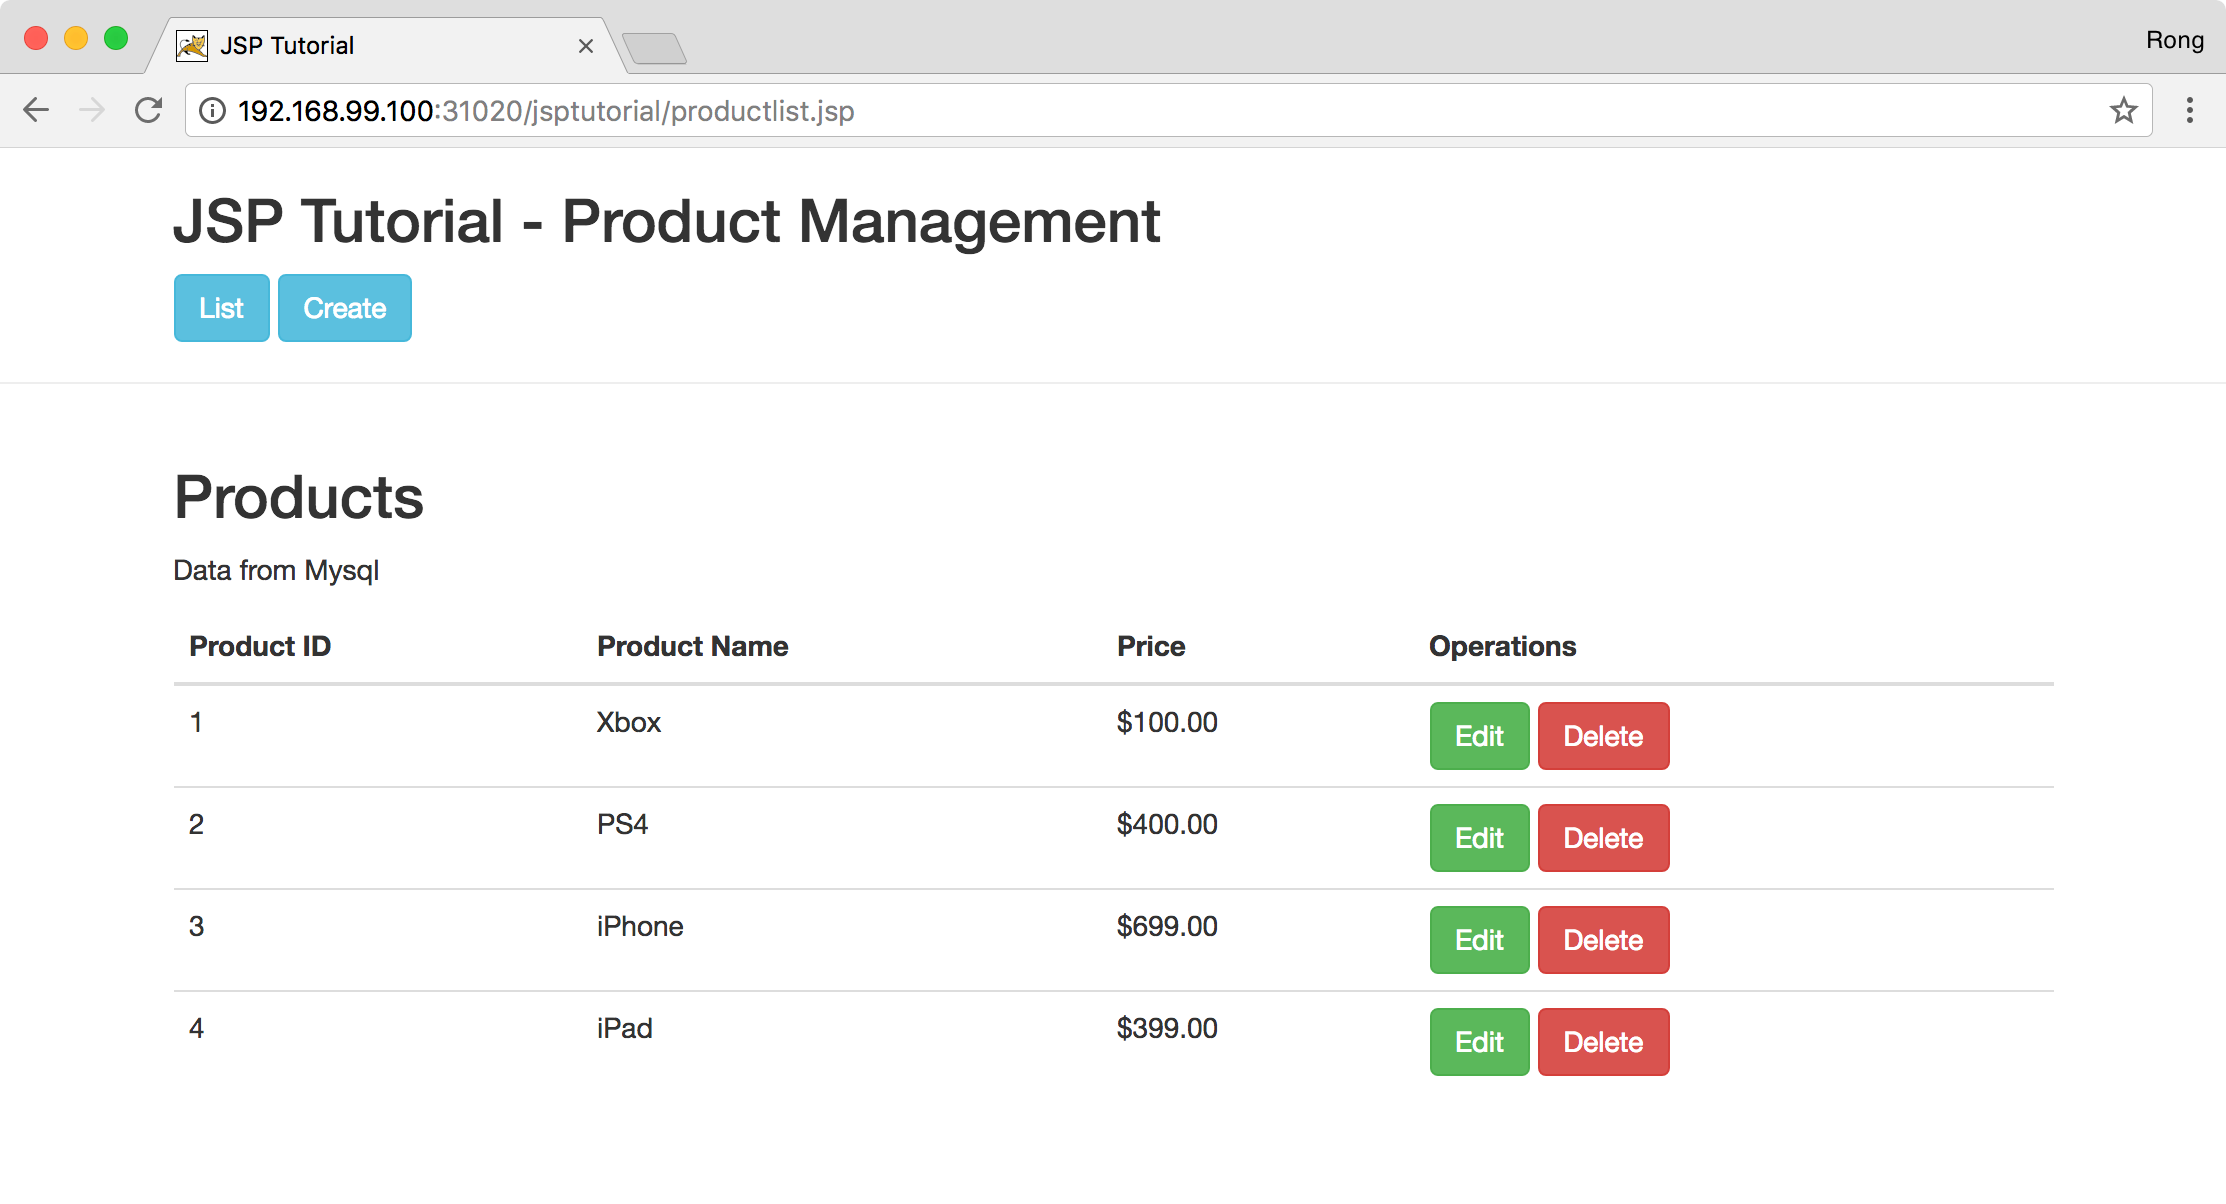
Access http://192.168.99.100:31020/jsptutorial/productlist.jsp in web browser. JSP Tutorial application is launched successfully! We still use port 31020. Port 8000 is only for debugging.
3. Setting up Debugging in Eclipse
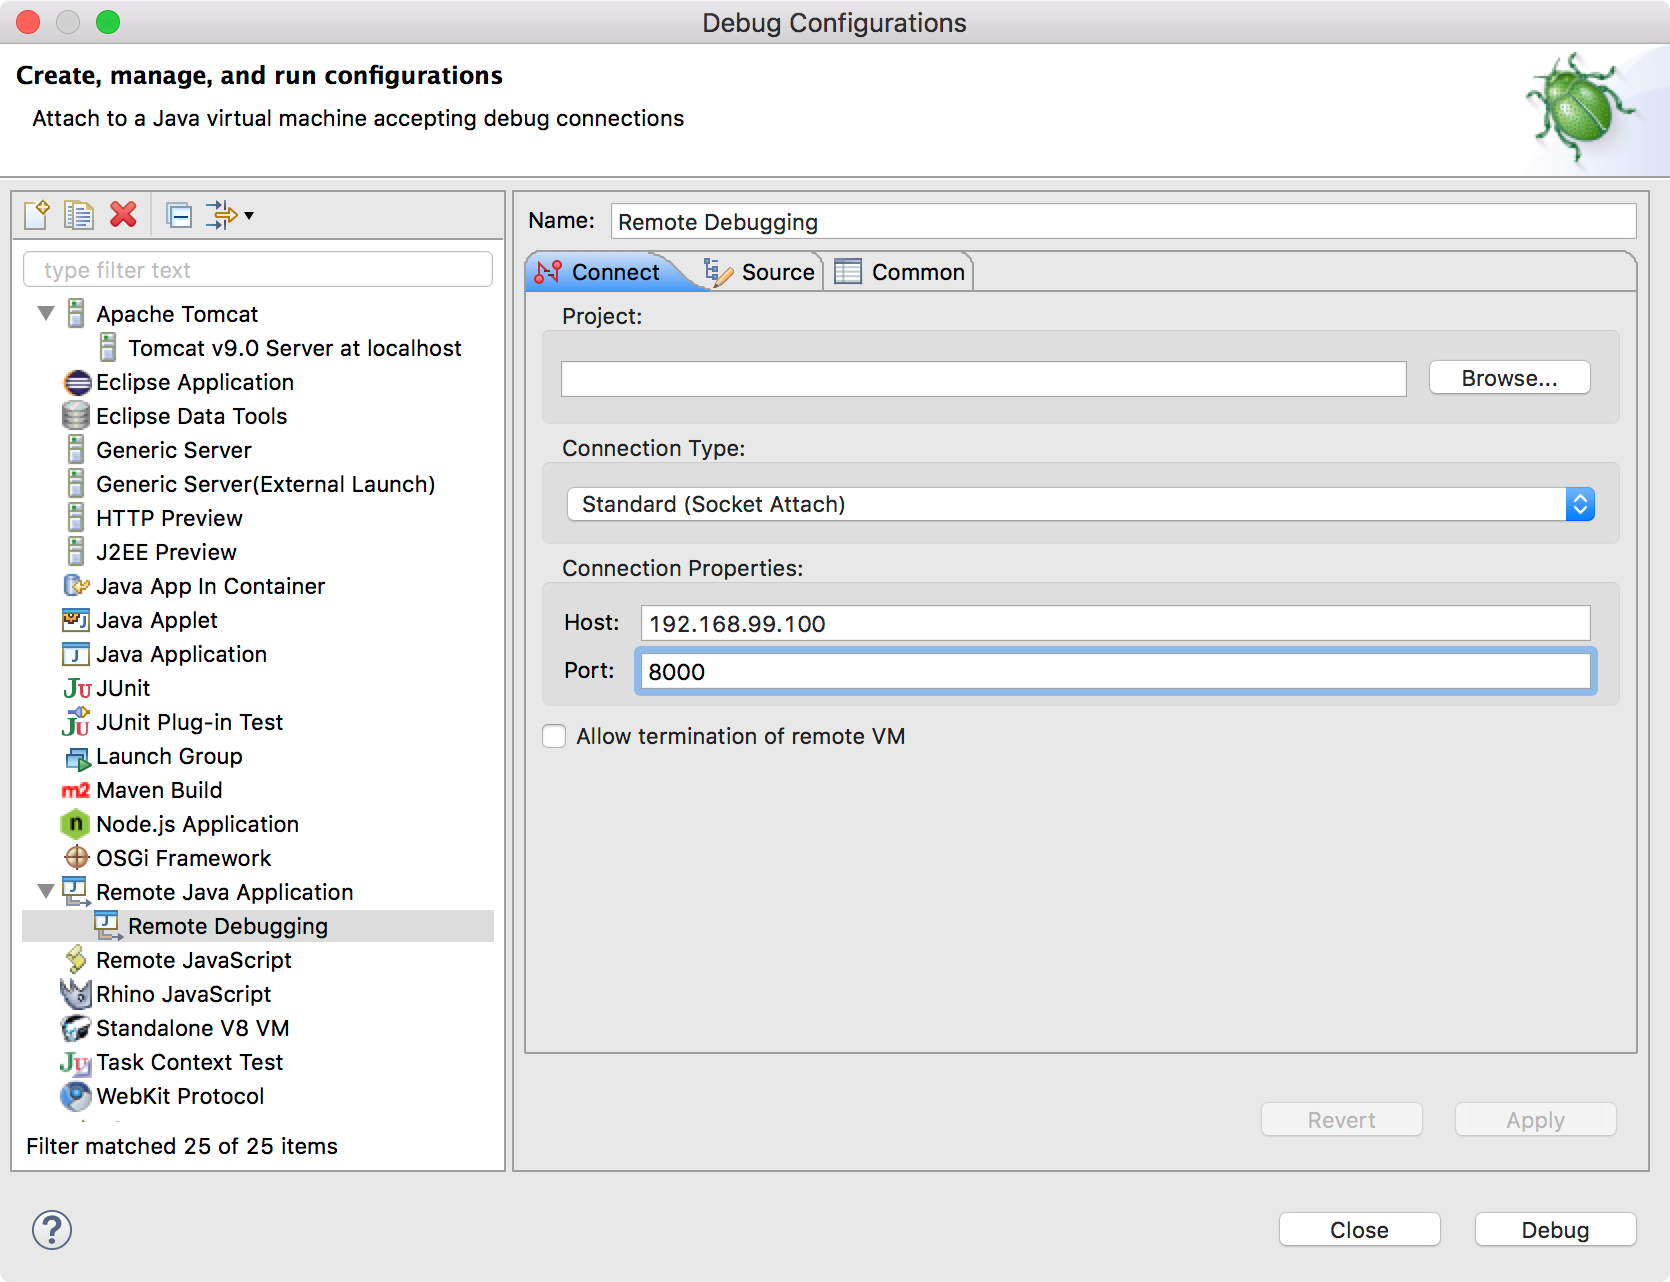
3.1 Creating Remote Java Application
In Eclipse, create new Remote Java Application. Set host with tomcat container’s IP address, and port 8000.
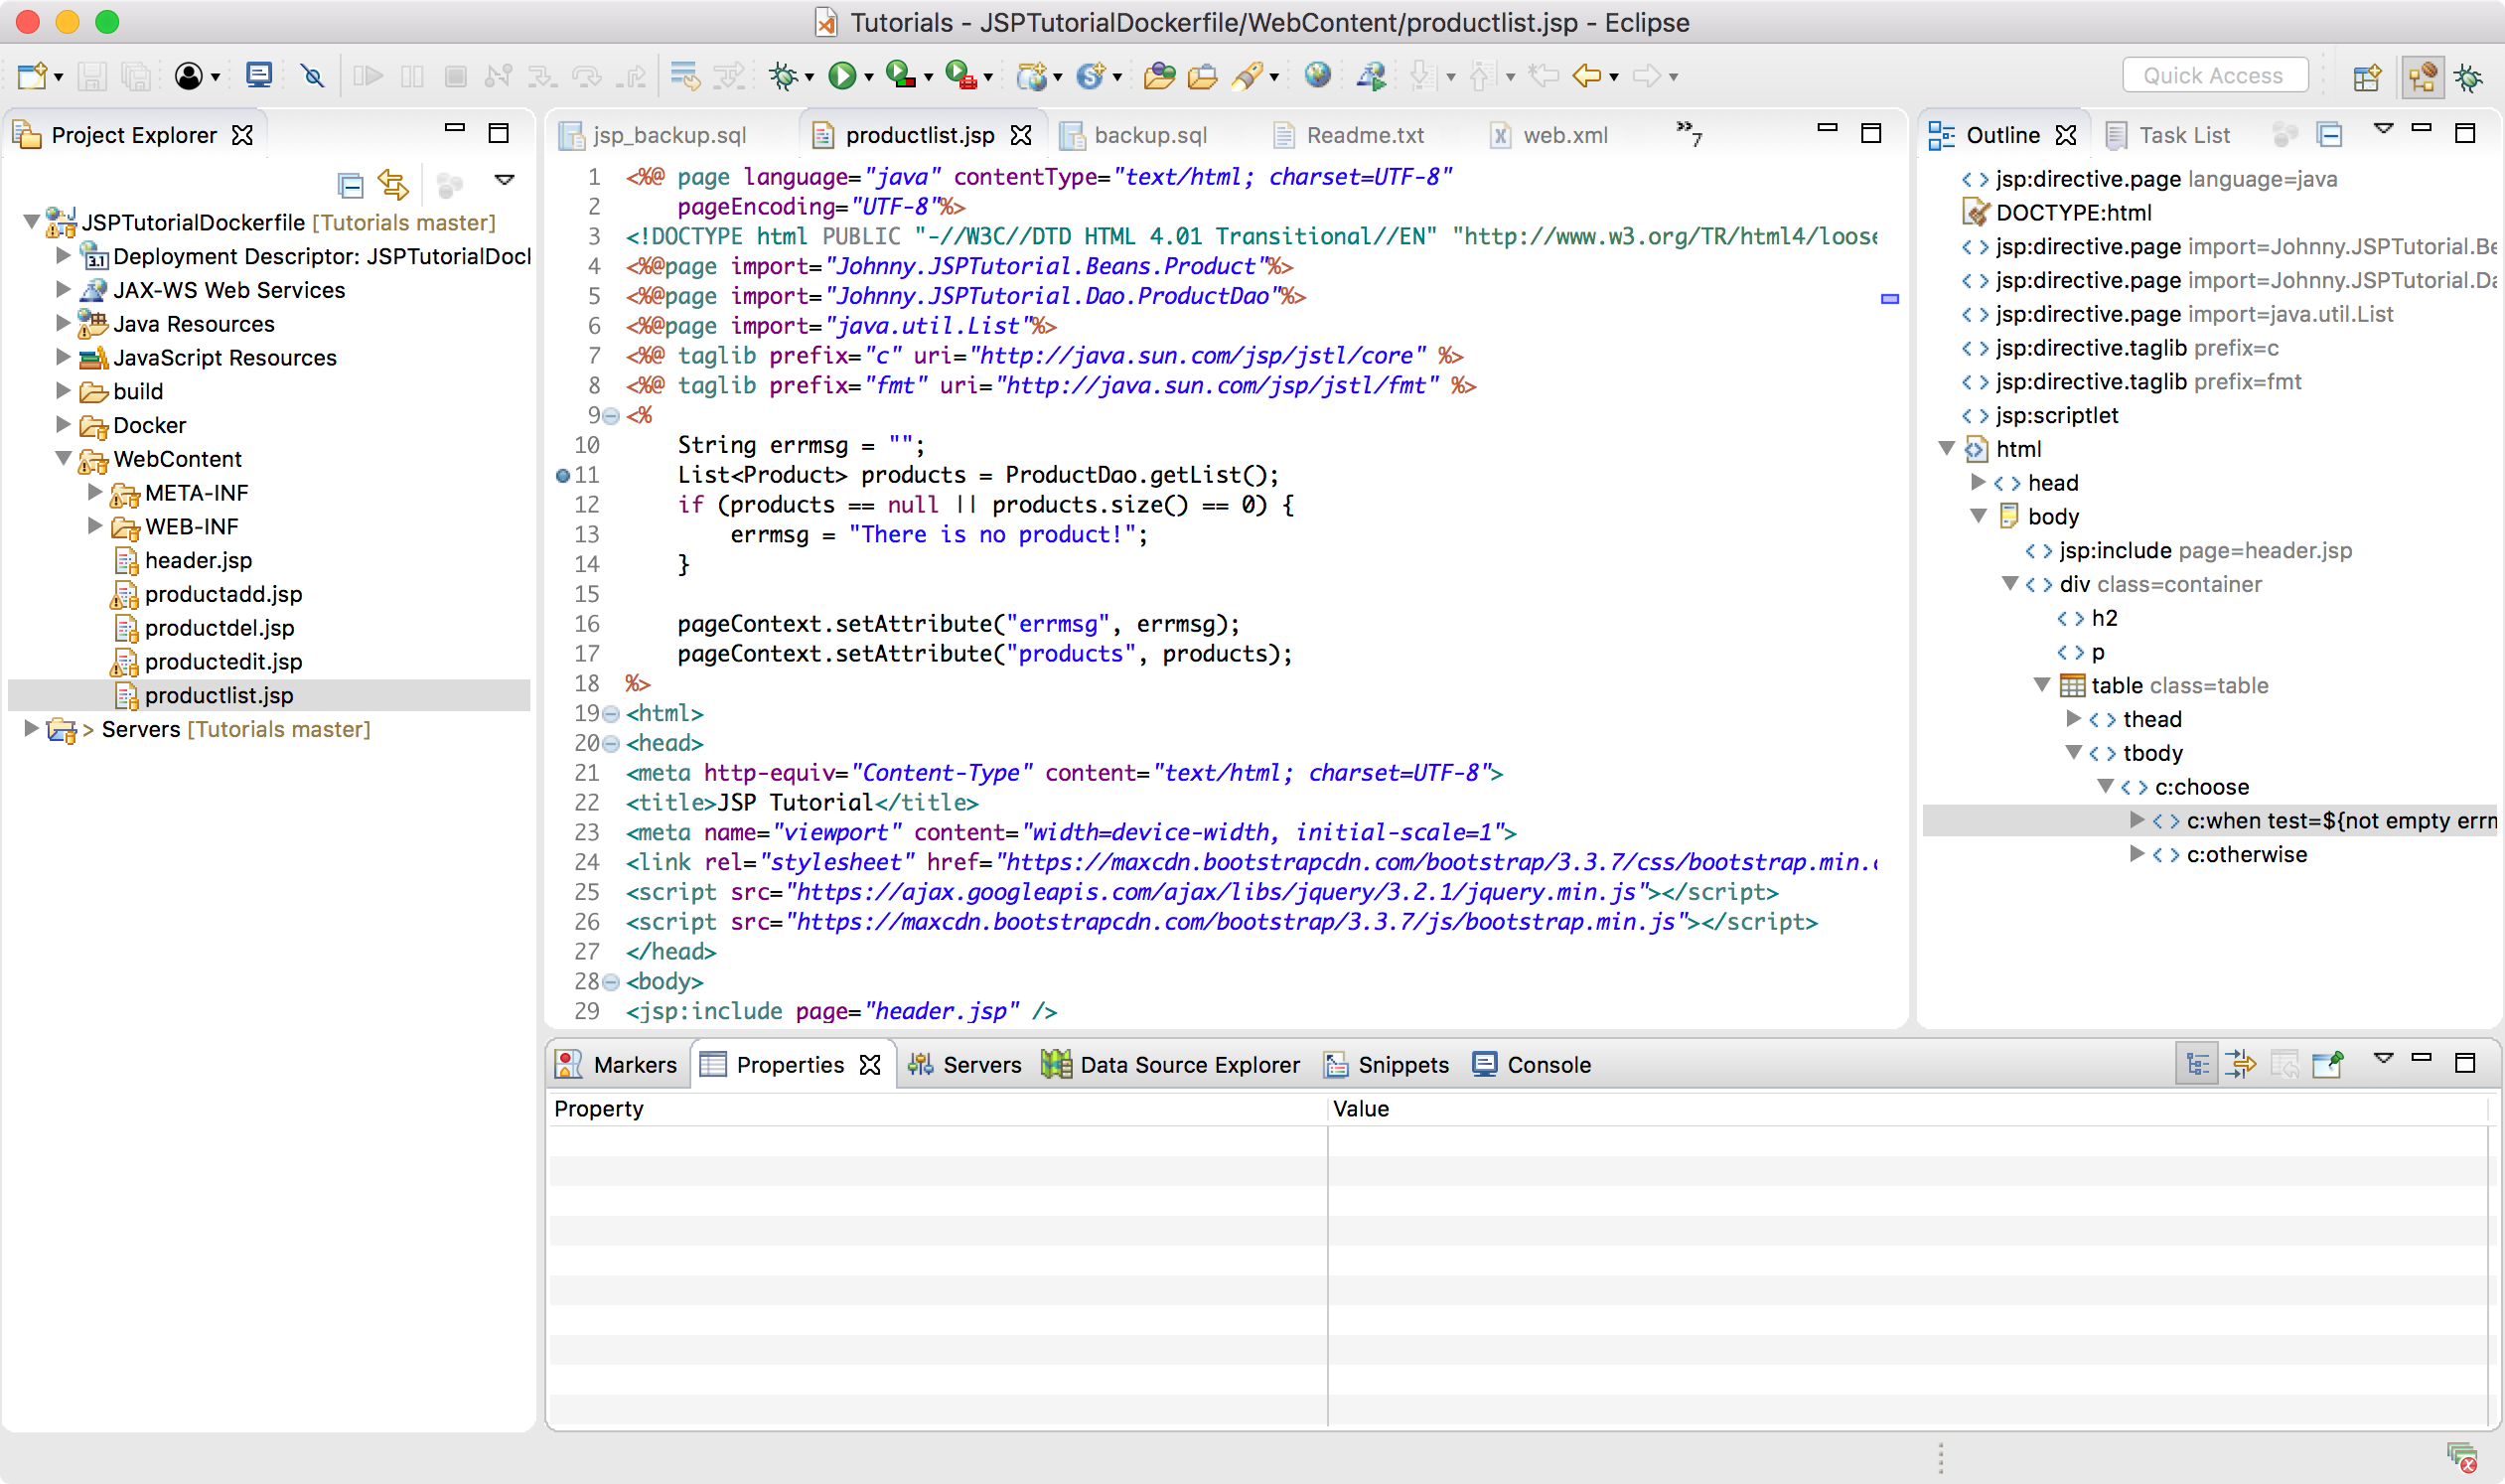
3.2 Setting Breakpoint
Find file productlist.jsp under WebContent, set breakpoint at line of ‘ProductDao.getList()’.
3.3 Enabling Debugging
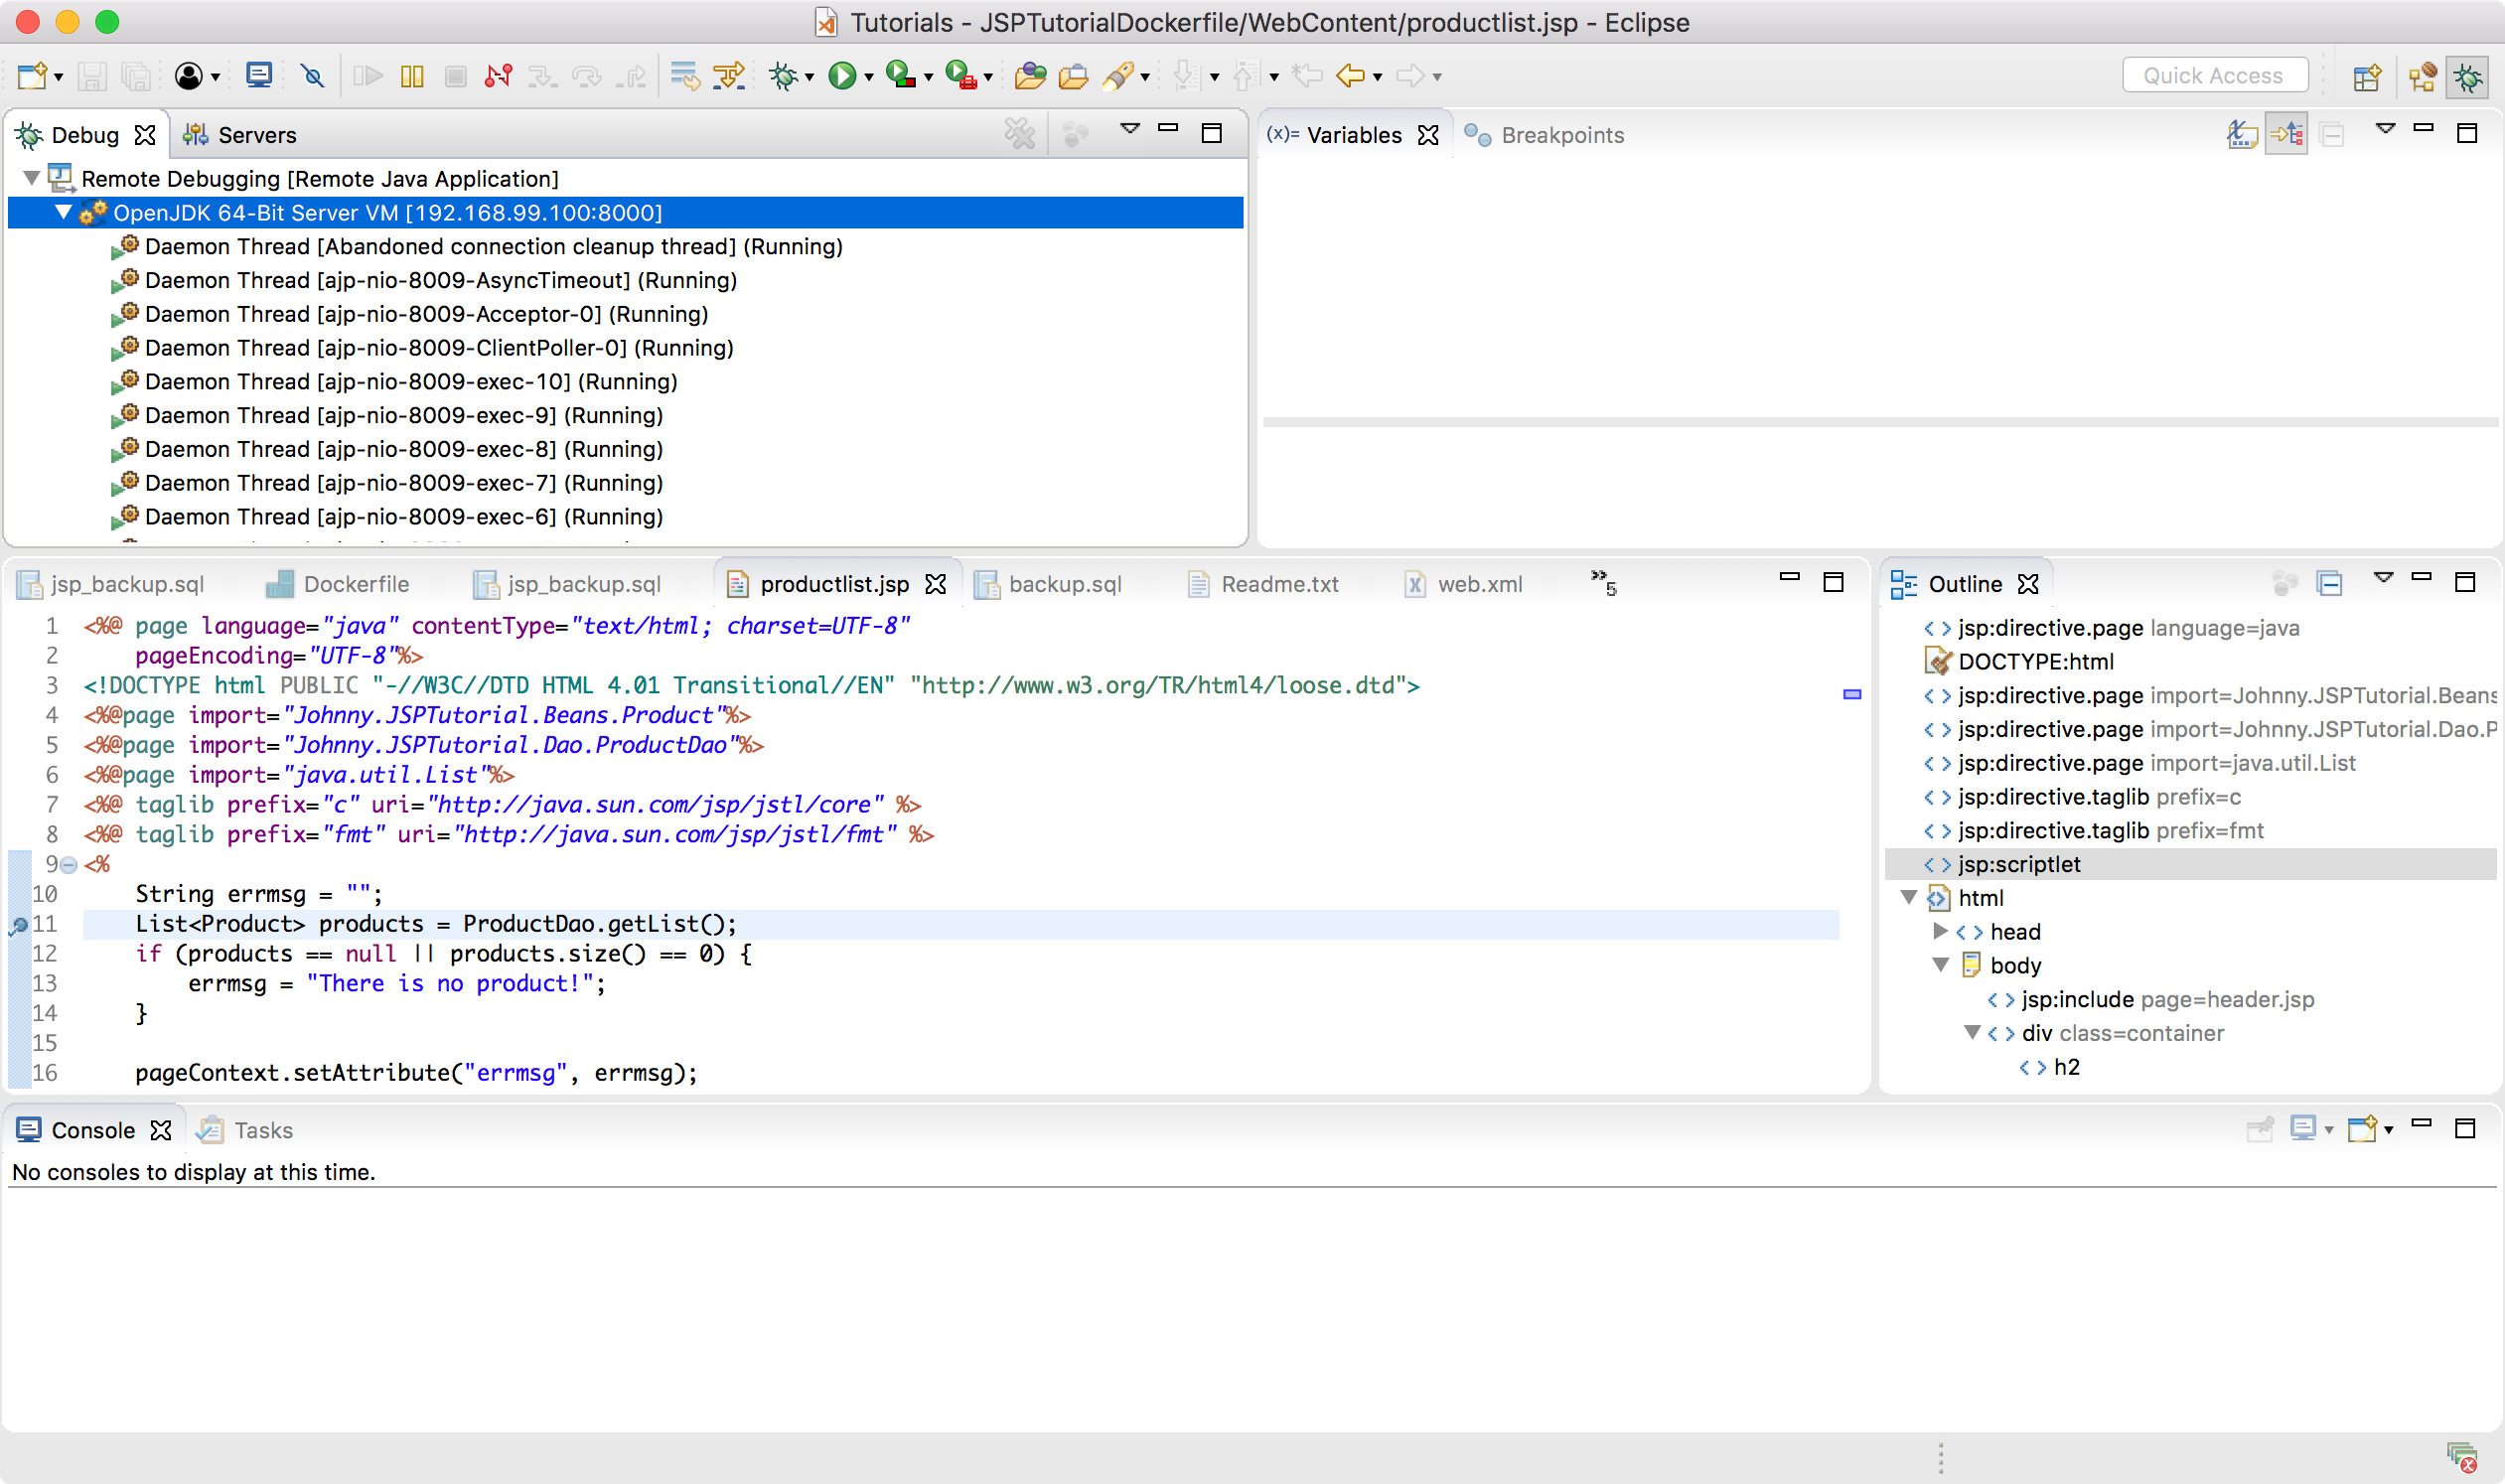
Switch to debug view, enable debugging. If you don’t see the Debug view, go to Windows->Perspective->Customize Perspective->Check the Debug option.
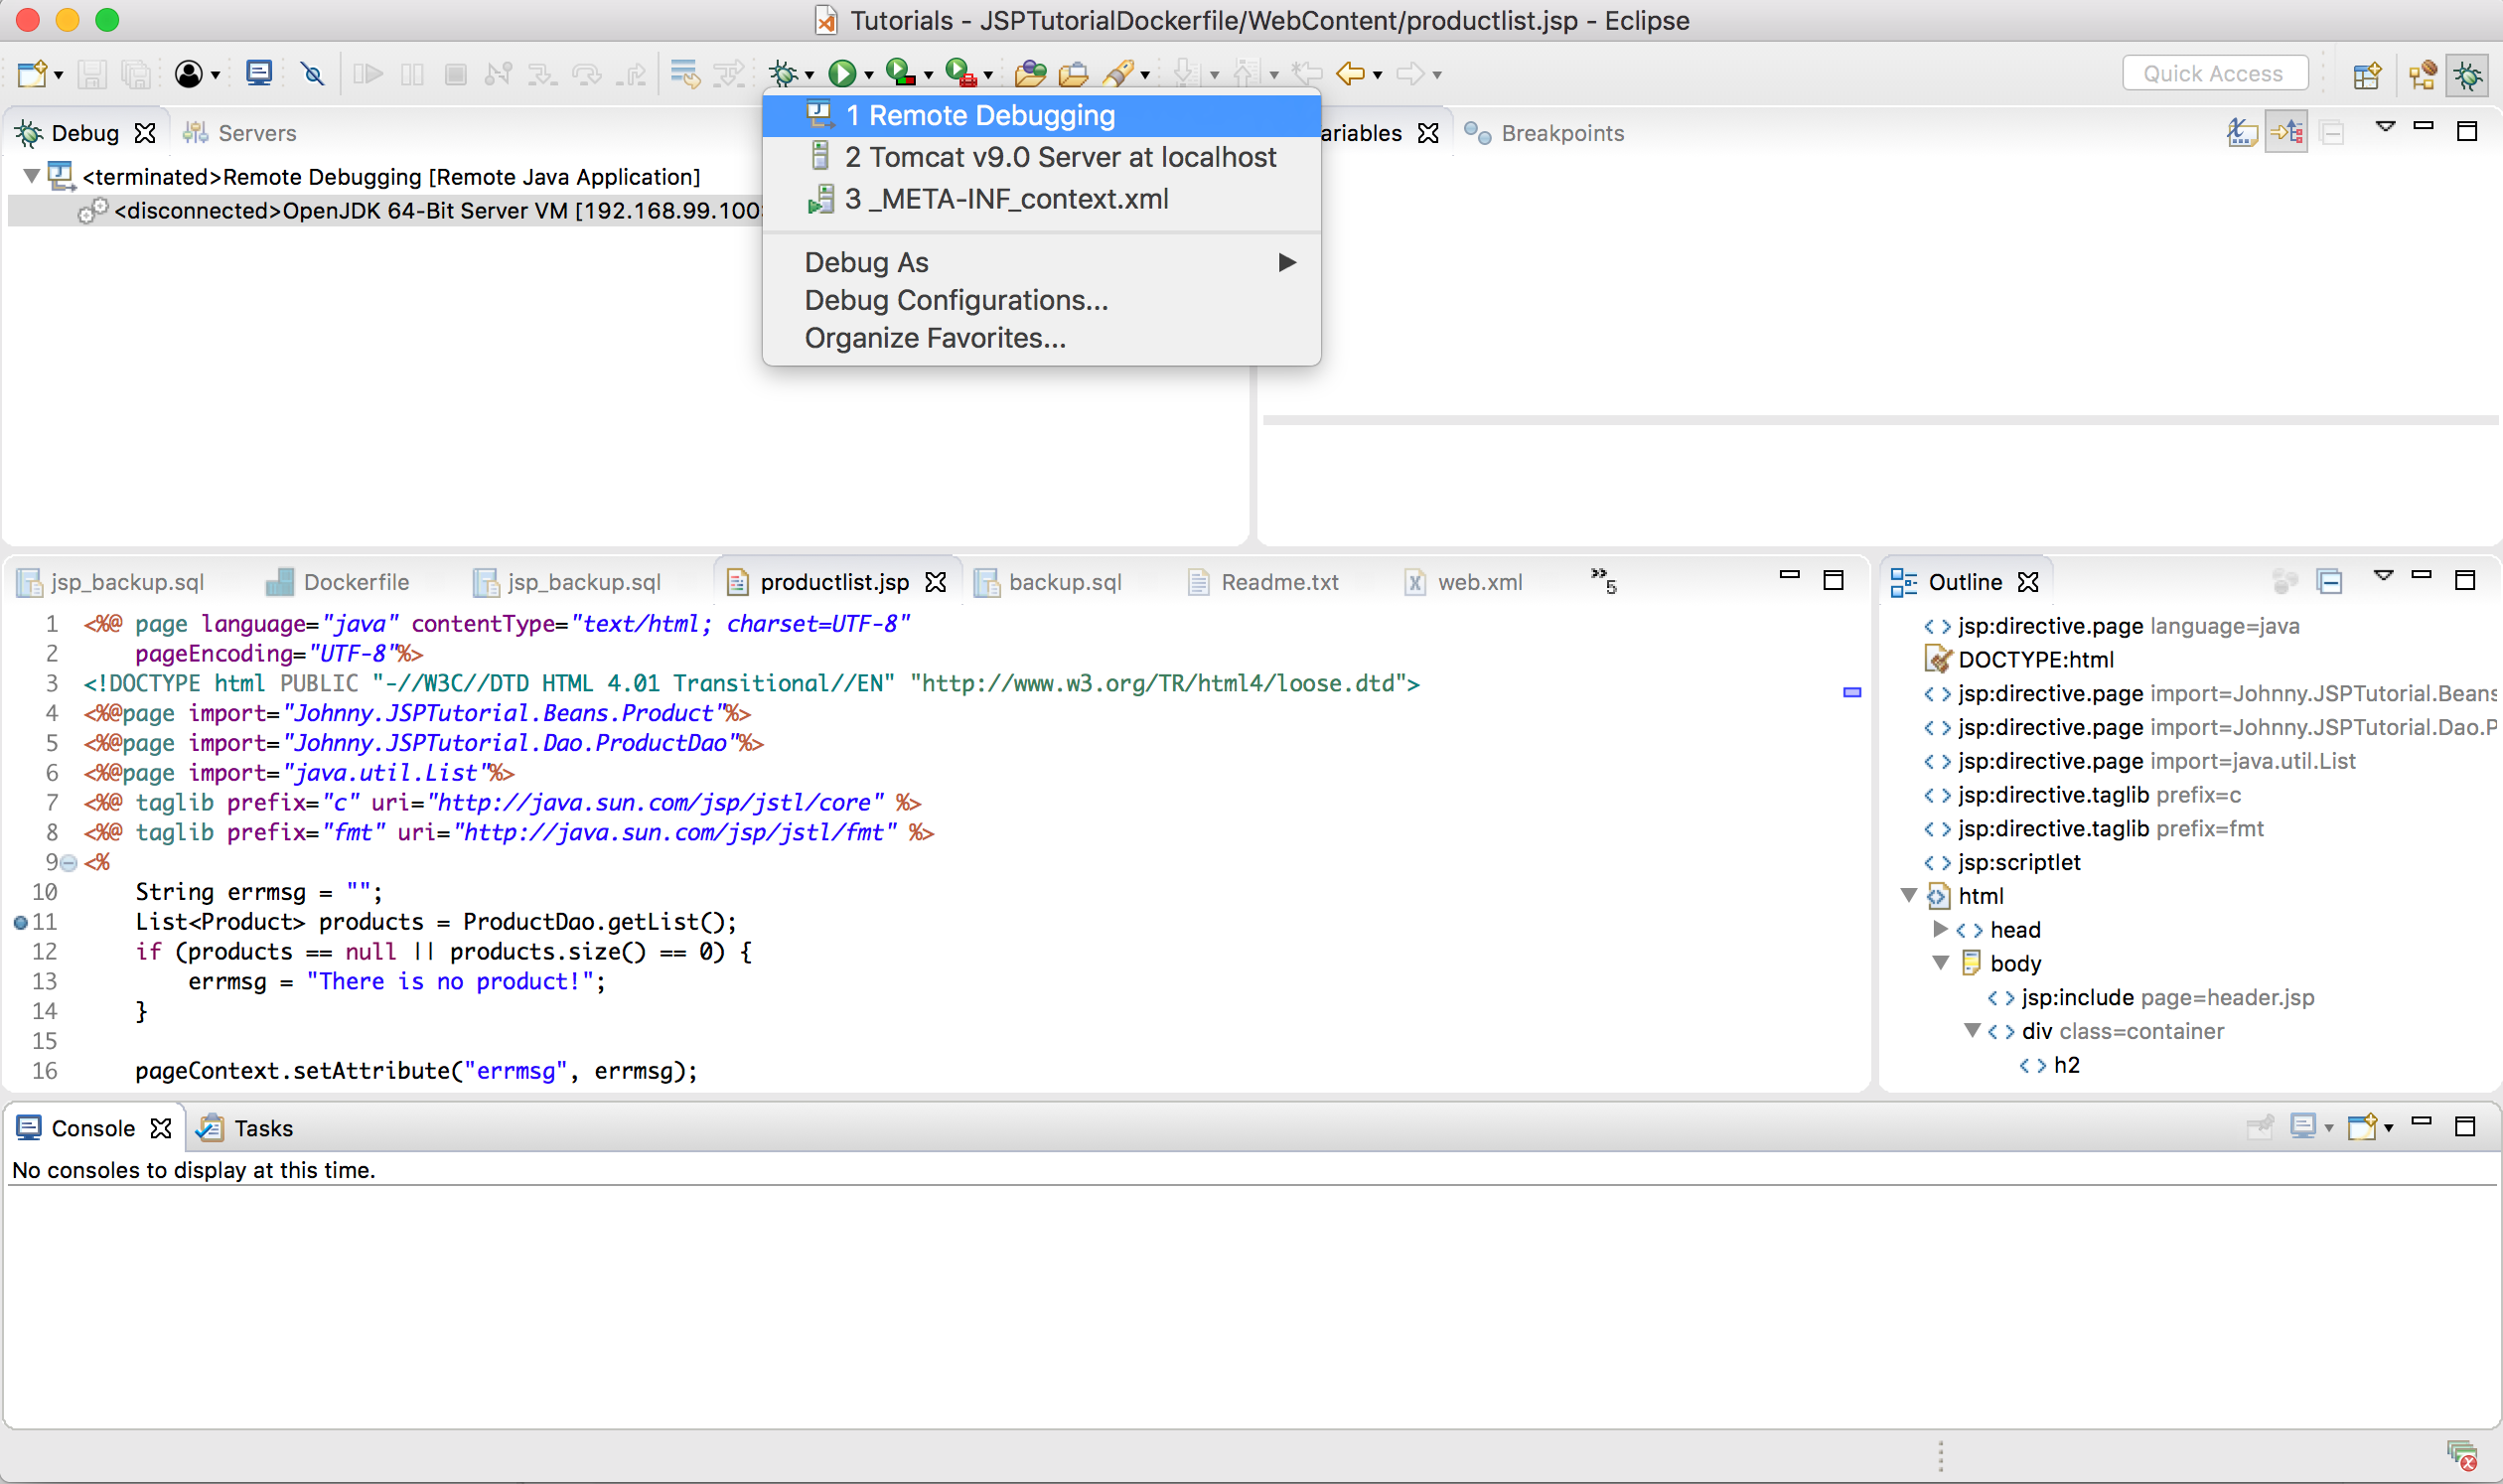
Then, you will see some Daemon Thread are listed in debug view.
4. Triggering Breakpoint
4.1 Accessing JSP Tutorial Website
Access http://192.168.99.100:31020/jsptutorial/productlist.jsp or refresh the productlist.jsp page in web browser. Switch to Eclipse, the breakpoint is activated. The remote debugging function is working now.
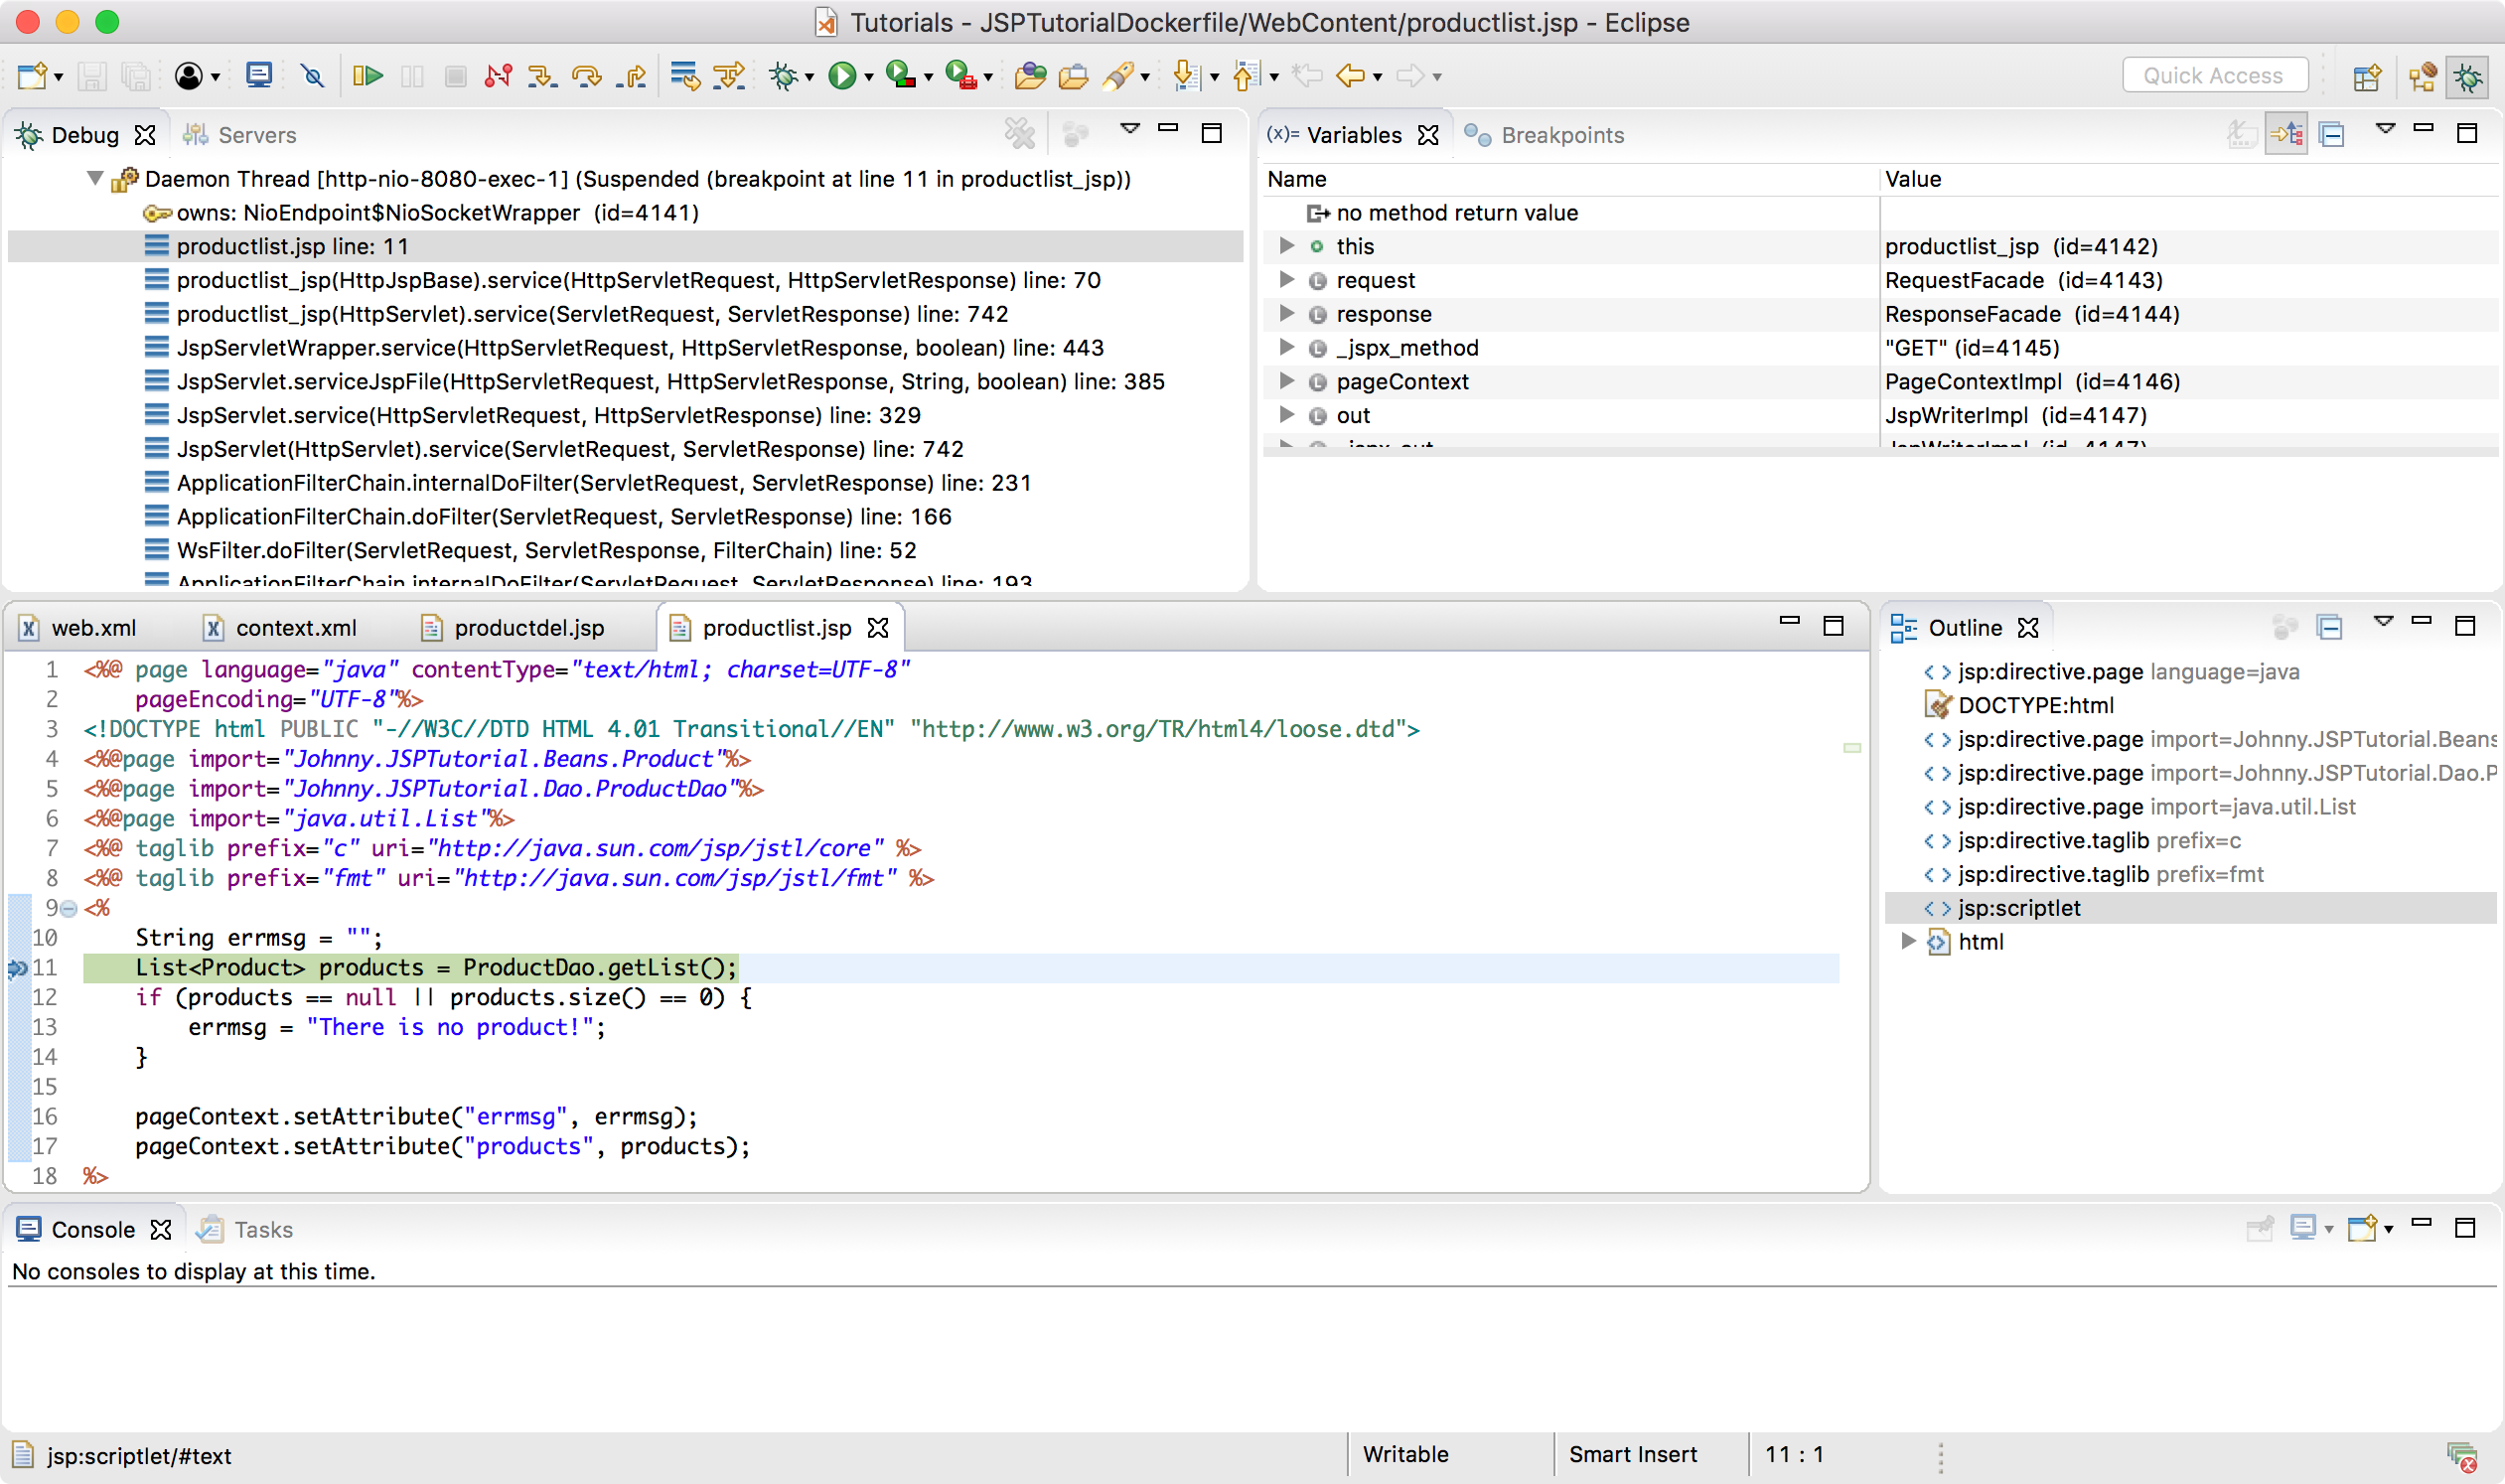
Meanwhile, JSP application is stuck, waiting response from tomcat server.
