2453. Java Advanced - Garbage CollectionGC, YG, and OG
Garbage Collection
1. Garbage Collection
The lifecycle of a Java object is managed by the JVM. Once an object is created by the programmer, we need not worry about the rest of its lifecycle. The JVM will automatically find those objects that are not in use anymore and reclaim their memory from the heap.
Garbage collection is a major operation that JVM does and tuning it for our needs, which can give a massive performance boosts to our application. There are a variety of garbage collection algorithms that are provided by modern JVMs. We need to be aware of our application’s needs to decide on which algorithm to use.
You cannot deallocate an object programmatically in Java, like you can do in non-GC languages like C and C++. Therefore, you cannot have dangling references in Java. However, you may have null references (references that refer to an area of memory where the JVM won’t ever store objects). Whenever a null reference is used, the JVM throws a NullPointerException.
The following GCs are used in modern JVMs
- Serial collector
- Throughput collector
- CMS collector
- G1 collector
Each of the above algorithms does the same task – finding objects that are no longer in use and reclaiming the memory that they occupy in the heap. One of the naive approaches to this would be to count the number of references that each object has and free it up as soon as the number of references turn 0 (this is also known as reference counting). Why is this naive? Consider a circular linked list. Each of its nodes will have a reference to it, but the entire object is not being referenced from external, and should be freed, ideally.
The JVM not only frees the memory, but also coalesces small memory chucks into bigger ones it. This is done to prevent memory fragmentation.
On a simple note, a typical GC algorithm does the following activities −
- Finding unused objects
- Freeing the memory that they occupy in the heap
- Coalescing the fragments
The GC has to stop application threads while it is running. This is because it moves the objects around when it runs, and therefore, those objects cannot be used. Such stops are called stop-the-world pauses and minimizing the frequency and duration of these pauses is what we aim while tuning our GC.
1.2 Memory Coalescing
A simple demonstration of memory coalescing is shown below
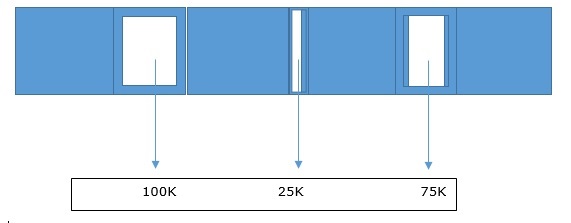 Memory Coalescing
The shaded portion are objects that need to be freed. Even after when all the space is reclaimed, we can only allocate an object of maximum size = 75Kb. This is even after we have 200Kb of free space as shown below
Memory Coalescing
The shaded portion are objects that need to be freed. Even after when all the space is reclaimed, we can only allocate an object of maximum size = 75Kb. This is even after we have 200Kb of free space as shown below
2. Generational GCs
Most JVMs divide the heap into three generations − the young generation (YG), the old generation (OG) and permanent generation (also called tenured generation). What are the reasons behind such thinking?
Empirical studies have shown that most of the objects that are created have very short lifespan −
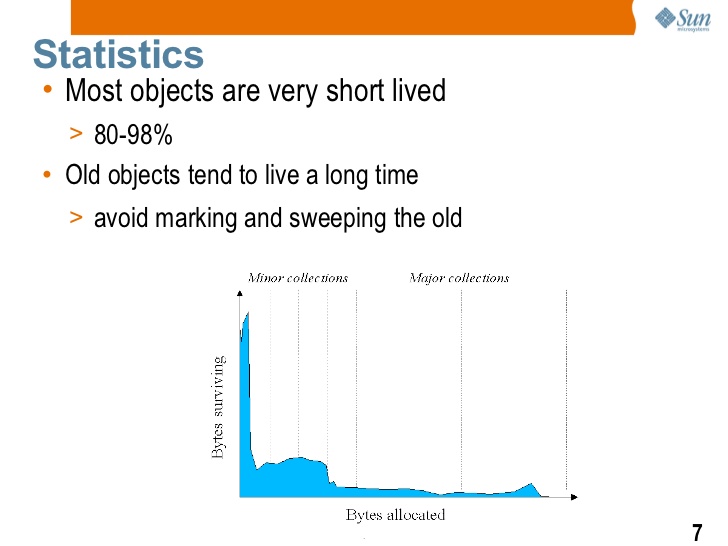
As you can see that as more and more objects are allocated with time, the number of bytes surviving becomes less (in general). Java objects have high mortality rate.
We shall look into a simple example. The String class in Java is immutable. This means that every time you need to change the contents of a String object, you have to create a new object altogether. Let us suppose you make changes to the string 1000 times in a loop as shown in the below code −
String str = “G11 GC”;

for(int i = 0 ; i < 1000; i++) {
   str = str + String.valueOf(i);
}
In each loop, we create a new string object, and the string created during the previous iteration becomes useless (that is, it is not referenced by any reference). The lifetime of that object was just one iteration – they’ll be collected by the GC in no time. Such short-lived objects are kept in the young generation area of the heap. The process of collecting objects from the young generation is called minor garbage collection, and it always causes a stop-the-world pause.
As the young generation gets filled up, the GC does a minor garbage collection. Dead objects are discarded, and live objects are moved to the old generation. The application threads stop during this process.
Here, we can see the advantages that such a generation design offers. The young generation is only a small part of the heap and gets filled up quickly. But processing it takes a lot lesser time than the time taken to process the entire heap. So, the ‘stop-the-world’ pauses in this case are much shorter, although more frequent. We should always aim for shorter pauses over longer ones, even though they might be more frequent. We shall discuss this in detail in later sections of this tutorial.
The young generation is divided into two spaces − eden and survivor space. Objects that have survived during the collection of eden are moved to survivor space, and those who survive the survivor space are moved to the old generation. The young generation is compacted while it is collected.
As objects are moved to the old generation, it fills up eventually, and has to be collected and compacted. Different algorithms take different approaches to this. Some of them stop the application threads (which leads to a long ‘stop-the-world’ pause since the old generation is quite big in comparison to the young generation), while some of them do it concurrently while the application threads keep running. This process is called full GC. Two such collectors are CMS and G1.
Let us now analyze these algorithms in detail.
2.1 Serial GC
It is the default GC on client-class machines (single processor machines or 32-bit JVM, Windows). Typically, GCs are heavily multithreaded, but the serial GC is not. It has a single thread to process the heap, and it will stop the application threads whenever it is doing a minor GC or a major GC. We can command the JVM to use this GC by specifying the flag: -XX:+UseSerialGC. If we want it to use some different algorithm, specify the algorithm name. Note that the old generation is fully compacted during a major GC.
2.2 Throughput GC
This GC is default on 64-bit JVMs and multi-CPU machines. Unlike the serial GC, it uses multiple threads to process the young and the old generation. Because of this, the GC is also called the parallel collector. We can command our JVM to use this collector by using the flag: -XX:+UseParallelOldGC or -XX:+UseParallelGC (for JDK 8 onwards). The application threads are stopped while it does a major or a minor garbage collection. Like the serial collector, it fully compacts the young generation during a major GC.
The throughput GC collects the YG and the OG. When the eden has filled up, the collector ejects live objects from it into either the OG or one of the survivor spaces (SS0 and SS1 in the below diagram). The dead objects are discarded to free up the space they occupied.
Before GC of YG
 After GC of YG
 During a full GC, the throughput collector empties the entire YG, SS0 and SS1. After the operation, the OG contains only live objects. We should note that both of the above collectors stop the application threads while processing the heap. This means long ‘stop-the- world’ pauses during a major GC. The next two algorithms aim to eliminate them, at the cost of more hardware resources −
2.3 CMS Collector
It stands for concurrent mark-sweep. Its function is that it uses some background threads to scan through the old generation periodically and gets rid of dead objects. But during a minor GC, the application threads are stopped. However, the pauses are quite small. This makes the CMS a low-pause collector.
This collector needs additional CPU time to scan through the heap while running the application threads. Further, the background threads just collect the heap and do not perform any compaction. They may lead to the heap becoming fragmented. As this keeps going on, after a certain point of time, the CMS will stop all the application threads and compact the heap using a single thread. Use the following JVM arguments to tell the JVM to use the CMS collector - XX:+UseConcMarkSweepGC -XX:+UseParNewGC.
Before GC
 After GC
 Note that the collection is being done concurrently.
2.4 G1 GC
This algorithm works by dividing the heap into a number of regions. Like the CMS collector, it stops the application threads while doing a minor GC and uses background threads to process the old generation while keeping the application threads going. Since it divided the old generation into regions, it keeps compacting them while moving objects from one region to another. Hence, fragmentation is minimum. You can use the flag: XX:+UseG1GC to tell your JVM to use this algorithm. Like CMS, it also needs more CPU time for processing the heap and running the application threads concurrently.
This algorithm has been designed to process larger heaps (> 4G), which are divided into a number of different regions. Some of those regions comprise the young generation, and the rest comprise the old. The YG is cleared using traditionally – all the application threads are stopped and all the objects that are still alive to the old generation or the survivor space.
Note that all GC algorithms divided the heap into YG and OG, and use a STWP to clear the YG up. This process is usually very fast.
3. Tuning the GC
3.1 Heap Size
The heap size is an important factor in the performance of our Java applications. If it is too small, then it will get filled frequently and as a result, will have to be collected frequently by the GC. On the other hand, if we just increase the size of the heap, although it need to be collected less frequently, the length of the pauses would increase.
Further, increasing the heap size has a severe penalty on the underlying OS. Using paging, the OS makes our application programs see much more memory than is actually available. The OS manages this by using some swap space on the disk, copying inactive portions of the programs into it. When those portions are needed, the OS copies them back from the disk to the memory.
Let us suppose that a machine has 8G of memory, and the JVM sees 16G of virtual memory, the JVM would not know that there is in fact only 8G available on the system. It will just request 16G from the OS, and once it gets that memory, it will continue using it. The OS will have to swap a lot of data in and out, and this is a huge performance penalty on the system.
And then comes the pauses which would occur during the full GC of such virtual memory. Since the GC will act on the entire heap for collection and compaction, it will have to wait a lot for the virtual memory to be swapped out of the disk. In case of a concurrent collector, the background threads will have to wait a lot for data to be copied from the swap space to the memory.
So here the question of how we should decide on the optimal heap size comes. The first rule is to never request the OS more memory than is actually present. This would totally prevent the problem for frequent swapping. If the machine has multiple JVMs installed and running, then the total memory request by all of them combined is less than the actual RAM present in the system.
You can control the size of memory request by the JVM using two flags −
- -XmsN − Controls the initial memory requested.
- -XmxN − Controls the maximum memory that can be requested.
The default values of both these flags depend upon the underlying OS. For example, for 64-bit JVMs running on the MacOS, -XmsN = 64M and -XmxN = minimum of 1G or 1/4th of the total physical memory.
Note that the JVM can adjust between the two values automatically. For example, if it notices that too much GC is happening, it will keep increasing the memory size as long as it is under -XmxN and the desired performance goals are met.
If you know exactly how much memory your application needs, then you can set -XmsN = -XmxN. In this case, the JVM does not need to figure out an “optimal” value of the heap, and hence, the GC process becomes a little more efficient.
3.2 Generation Sizes
You can decide on how much of the heap do you want to allocate to the YG, and how much of it you want to allocate to the OG. Both of these values affect the performance of our applications in the following way.
If the size of the YG is very large, then it would be collected less frequently. This would result in lesser number of objects being promoted to the OG. On the other hand, if you increase OG’s size too much, then collecting and compacting it would take too much time and this would lead to long STW pauses. Thus, the user has to find a balance between these two values.
Below are the flags that you can use to set these values −
- -XX:NewRatio=N: Ratio of the YG to the OG (default value = 2)
- -XX:NewSize=N: YG’s initial size
- -XX:MaxNewSize=N: YG’s max size
- -XmnN: Set NewSize and MaxNewSize to the same value using this flag
The initial size of the YG is determined by the value of NewRatio by the given formula −
(total heap size) / (newRatio + 1)
Since the initial value of newRatio is 2, the above formula gives the initial value of YG to be 1/3 of the total heap size. You can always override this value by explicitly specifying the size of the YG using the NewSize flag. This flag does not have any default value, and if it is not set explicitly, the size of the YG will keep getting calculated using the above formula.
3.3 Permagen and Metaspace
The permagen and the metaspace are heap areas where the JVM keeps classes’ metadata. The space is called the ‘permagen’ in Java 7, and in Java 8, it is called the ‘metaspace’. This information is used by the compiler and the runtime.
You can control the permagen’s size using the following flags: -XX: PermSize=N and -XX:MaxPermSize=N. Metaspace’s size can be controlled using: -XX:Metaspace- Size=N and -XX:MaxMetaspaceSize=N.
There are some differences how the permagen and the metaspace are managed when the flag values are not set. By default, both have a default initial size. But while the metaspace can occupy as much of the heap as is needed, the permagen can occupy no more than the default initial values. For example, the 64-bit JVM has 82M of heap space as maximum permagen size.
Note that since the metaspace can occupy unlimited amounts of memory unless specified not to, there can be an out of memory error. A full GC takes place whenever these regions are getting resized. Hence, during startup, if there are a lot of classes that are getting loaded, the metaspace can keep resizing resulting in a full GC every time. Thus, it takes a lot of time for large applications to startup in case the initial metaspace size is too low. It is a good idea to increase the initial size as it reduces the startup time.
Though the permagen and metaspace hold the class metadata, it is not permanent, and the space is reclaimed by the GC, as in case of objects. This is typically in case of server applications. Whenever you make a new deployment to the server, the old metadata has to be cleaned up as new class loaders will now need space. This space is freed by the GC.