9708. Analyzing Performance Issue with SplunkSplunk and Log Analysis
Use Splunk logs to analyze performance issues in production.
1. Issue in Production
Recently, I was working on a performance issue which occurs in our procurement system on the cloud. In our cloud-based procurement system, the customer has to wait for one minute to get response after he clicks the ‘Save’ button on Invoice Reconciliation(IR) document. This IR contains over one hundred line items. There is no available tools for debugging on the cloud. I have to reproduce the issue locally by copying the configuration from cloud to my local sandbox, importing some master data and creating a similar IR document. The root cause is because of the validation on the fields of IR. However, I couldn’t narrow down what exact field caused this issue. There are hundreds of fields on IR and on each line item. It seems there is no single bottleneck. Instead, it’s an accumulated performance issue. To get the whole picture of how exactly the time is consumed, I added logs to the validation method to capture the time spent for each field. Later, I imported these logs to Splunk for analyzing.
2. Creating Logging Function
For IR document, it has two level attributes. The first level is the fields on itself, we call it header level. The second level is the line items, we call it line level. We need to get the logs for both two levels.
- Level_0: Time consumed by fields on header level of IR document
- Level_1: Time consumed by fields on line level of IR document
For each field, we need the following information:
- Level // 0: header level; 1: line level
- Class // field belongs to which class
- FieldName // field name
- TimeSpent // in millisecond
Exmaple of the log:
Wed Feb 8 17:13:56 PDT 2017  (fieldTiming:DEBUG) : Level=0, Class=ariba.invoicing.core.InvoiceReconciliation, FieldName=TotalCost, TimeSpent=1 ms
Wed Feb 8 17:14:31 PDT 2017  (fieldTiming:DEBUG) : Level=1, Class=ariba.invoicing.core.InvoiceReconciliationLineItem, FieldName=cus_SupervisorTotalMismatch, TimeSpent=91 ms
3. Steps for Analyzing
3.1 Getting the Logs
Turn on the logging function, reproduce the issue, export the log file.
3.2 Importing Log File to Splunk
In Splunk, import log file.
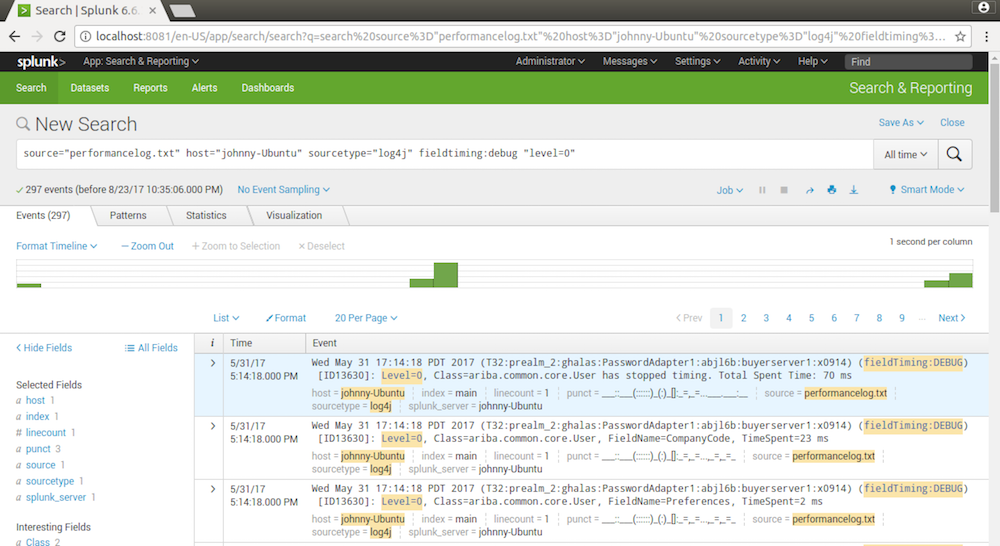
3.3 Searching the Logs for Header Level
Get the logs for level=0(header level).
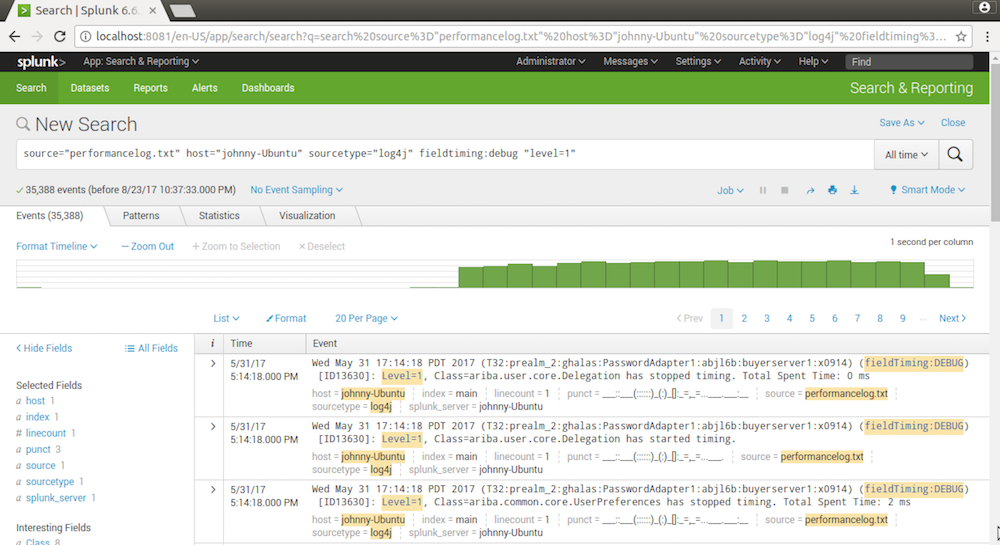
source="performancelog.txt" host="johnny-Ubuntu" sourcetype="log4j" fieldtiming:debug "level=0"
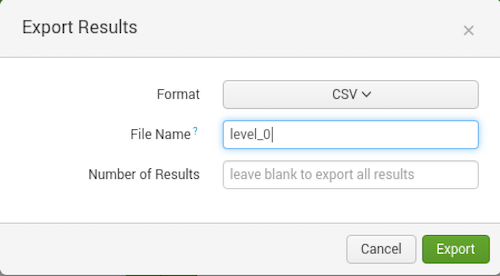
3.4 Exporting to CSV File
Export the search result to csv file.
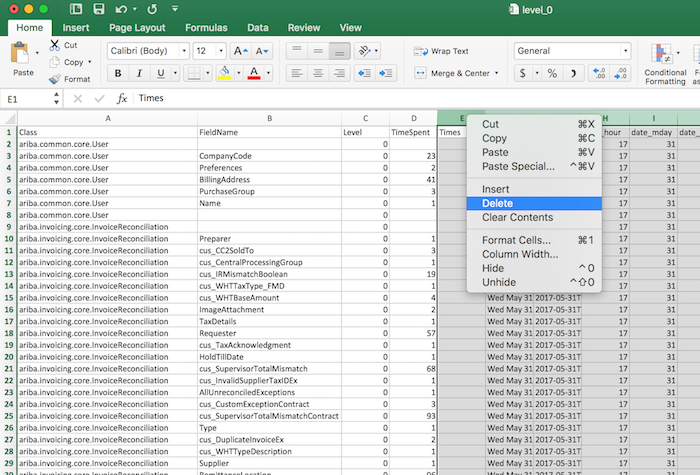
3.5 Processing the CSV File
Use Microsoft Excel for the rest steps, since Excel is good at handling csv files.
Open the csv file, eliminate all other columns except Level, Class, FieldName and TimeSpent.
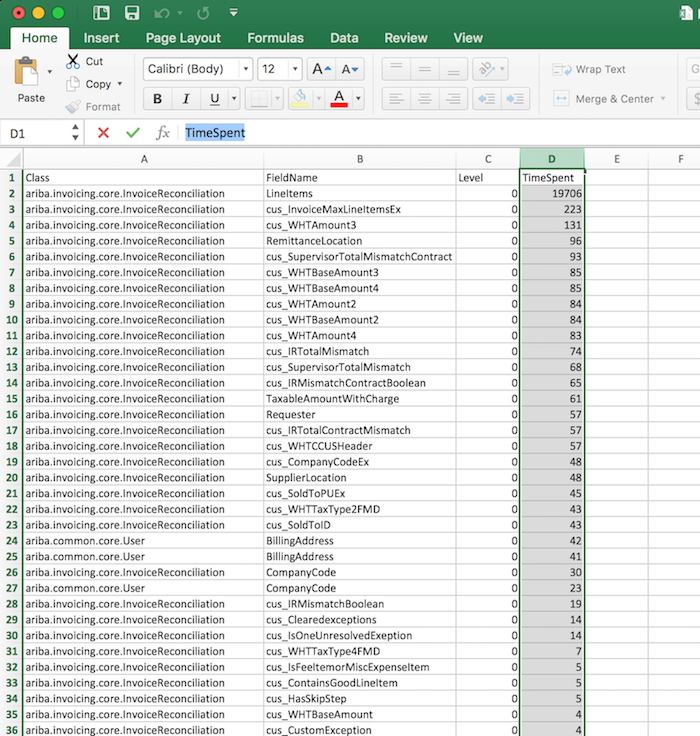
Then, sort the ‘TimeSpent’ column in descending order. Now, we see that field ‘LineItems’ on IR consumes 19.7 seconds. We find the bottleneck.
3.6 Searching the Logs for Line Level
Now, we take the same steps to get the logs for level=1(line level).
source="performancelog.txt" host="johnny-Ubuntu" sourcetype="log4j" fieldtiming:debug "level=1"
Open the csv file, eliminate all other columns except Level, Class, FieldName and TimeSpent.
Then, sort the ‘TimeSpent’ column in descending order.
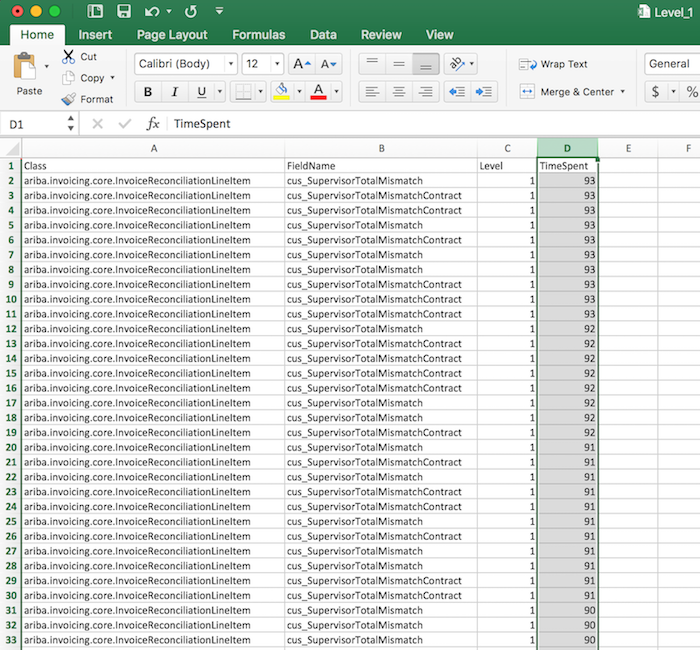
Notice that there are two fields consumes lots of time. Each field takes about 90 millisecond for validation. The total time would be 90 * 2 * 100 = 18000 millisecond = 18 seconds, almost all of the proportion of LineItems.
- cus_SupervisorTotalMismatch
- cus_SupervisorTotalMismatchContract
3.7 Conclusion
Finally, we find the main cause is because of these two customized fields configured in customer’s system. After checking the definition of these two fields, I found there were some duplicated calculations in its expression. The final solution is to move these two fields from line level(line item) to header level(IR document).