2512. Using Java DebuggerJDB and Debugging
The Java Debugger, commonly known as jdb, is a useful tool to detect bugs in Java programs.
1. What Is JDB?
The Java debugger (JDB) is a tool for Java classes to debug a program in command line. It implements the Java Platform Debugger Architecture. It helps in detecting and fixing bugs in a Java program using Java Debug Interface (JDI).
2. JDB in JDK
The following architecture defines the role of JDB in JDK. It contains mainly three units:
- Java Virtual Machine Tool Interface (JVM TI)
- Java Debug Wiring Pool (JDWP)
- Java Debugger Interface (JDI)
3. Using JDB
3.1 Syntax
The syntax of JDB is as follows.
jdb [ options ] [ class ] [ arguments ]
- JDB - It calls jdb.exe from the Java Development Kit.
- Options - These include the command line options used to debug a Java program in an efficient way. The JDB launcher accepts all the options (such as -D, -classpath, and -X) and some additional advanced options such as (-attach, -listen, -launch, etc.).
- Class - It is the class name on which you want to perform debugging operations.
- Arguments - These are the input values given to a program at runtime. For example, arg[0], arg[1] to the main() method.
3.2 Creating Test Class
Create a file named ‘Sum.java’ with following codes. Class Sum has a main method which accepts two input parameters. This method calculates the sum of these two input parameters and print the sum.
public class Sum {
    public static void main(String[] args){
        int val1 = Integer.parseInt(args[0]);
        int val2 = Integer.parseInt(args[1]);
        int sum = val1 + val2;
        System.out.println("Sum is " + sum);
    }
}
3.3 Compiling and Running
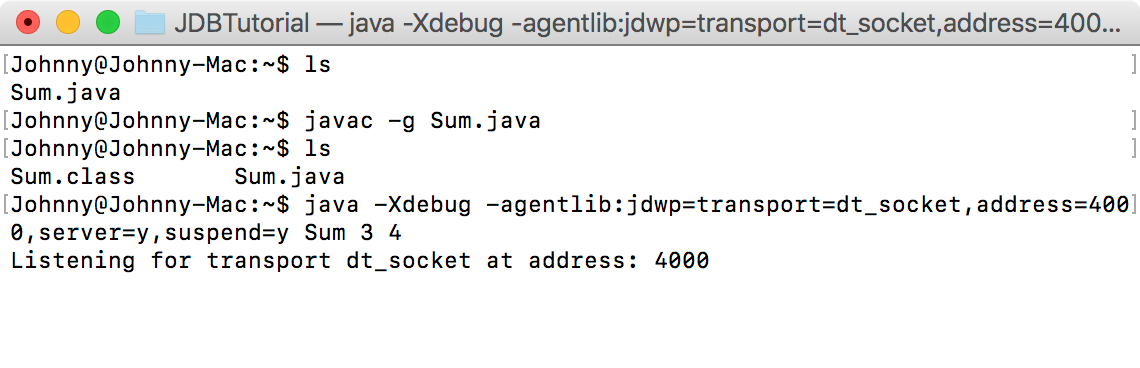
Navigate to the folder where Sum.java locates, use javac to compile it. The g option adds extra debug info to the class.
$ javac -g Sum.java
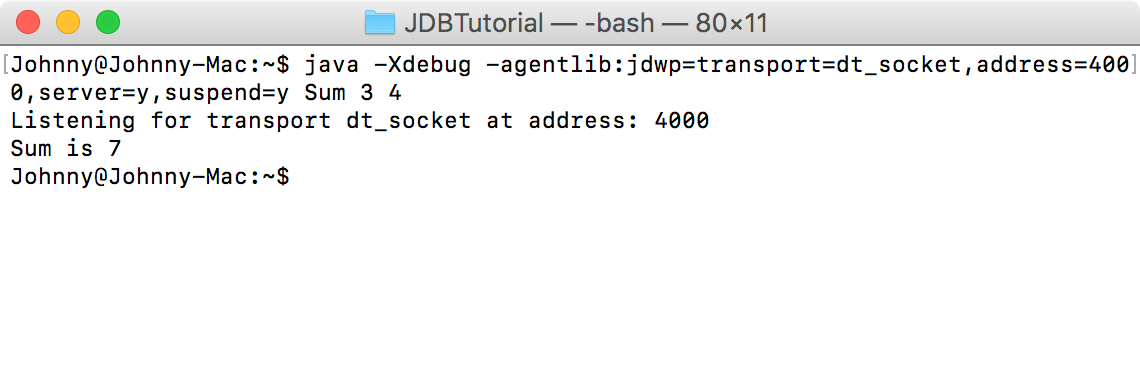
Run Sum in debug mode with providing two input parameters, 3 and 4. Now we have the application listening on port 4000 waiting for connections.
$ java -Xdebug -agentlib:jdwp=transport=dt_socket,address=4000,server=y,suspend=y Sum 3 4
- With
suspend=ythe Java-process will wait until the debugger connects, with suspend=n you will be also able to debug the application servers startup process. - The option
server=yopens a socket and listens for incoming debugger requests. With server=n the debugged application will try to connect actively to a debugger and run therefore as a client.
3.4 Debugging with JDB
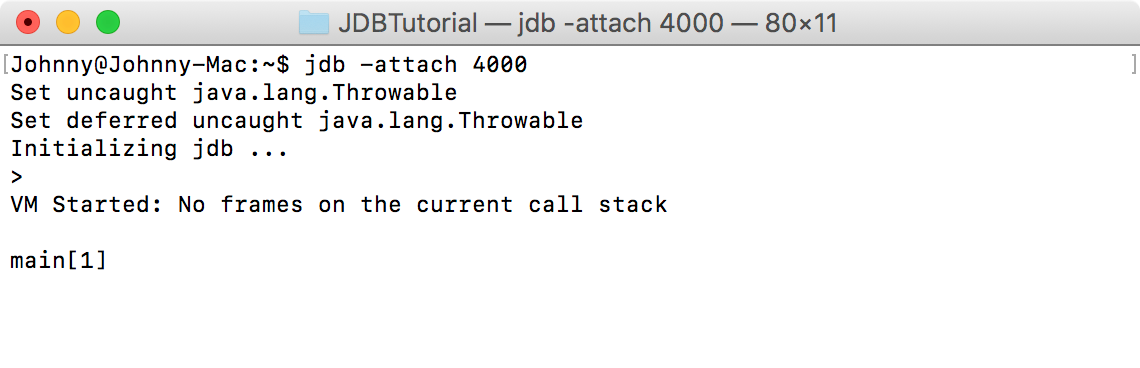
Open another terminal, use jdb to start a new debug session. The attach option attaches the debugger to the running VM by specifying the specific port 4000.
jdb -attach 4000
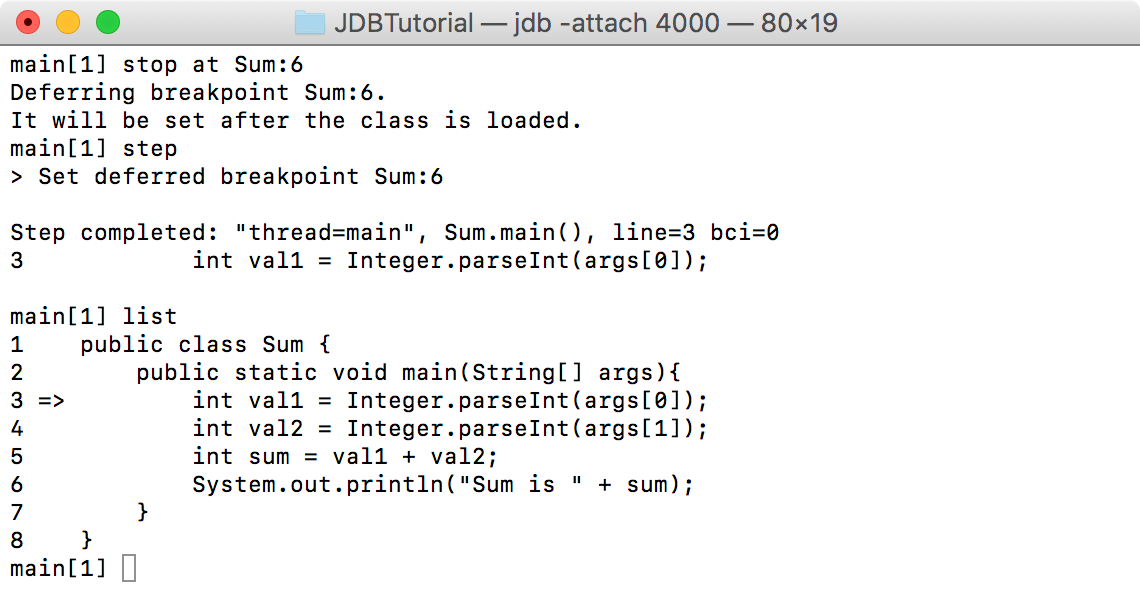
Use stop command to set breakpoint to line 6, which is ‘System.out.println(“Sum is “ + sum);’.
main[1] stop at Sum:6
Use step command to step the execution to the next line.
main[1] step
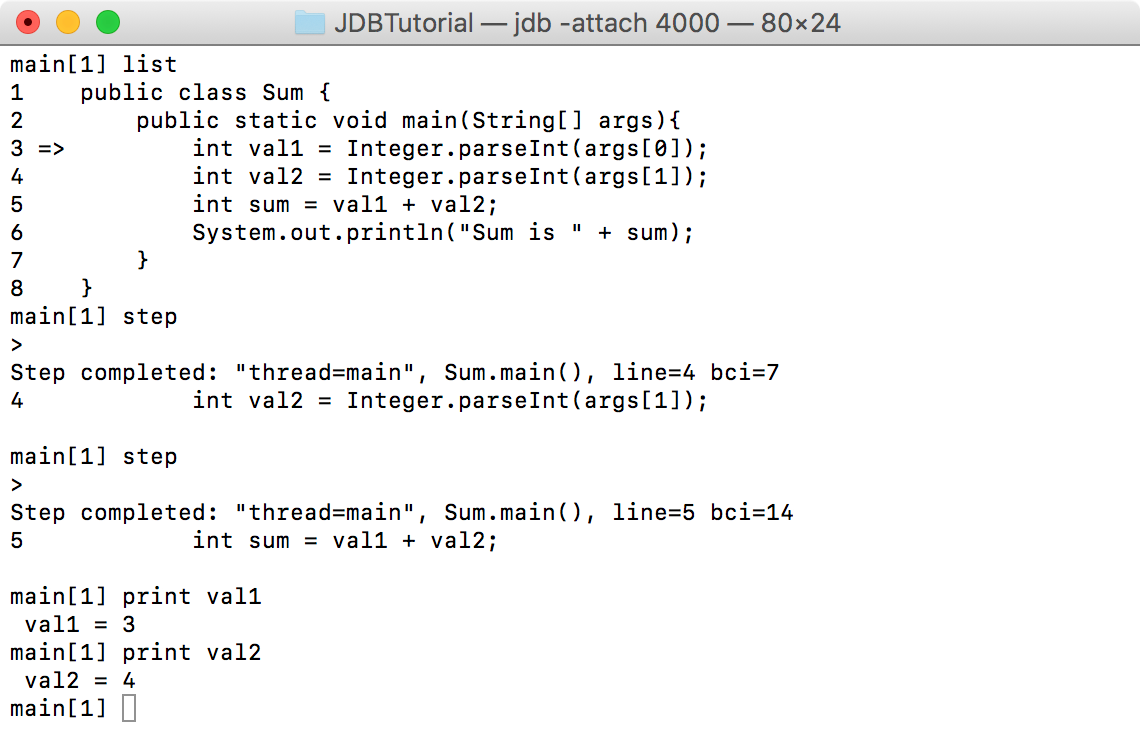
Use list command to know the line in the code up to which the program control has reached. Notice the arrow mark => in the following screenshot that shows the current position of the program control.
main[1] list
 Step twice, then use
 print command to check the values of val1 and val2. (If there is any object, you can use dump command to check the current value of each field defined in the object.)
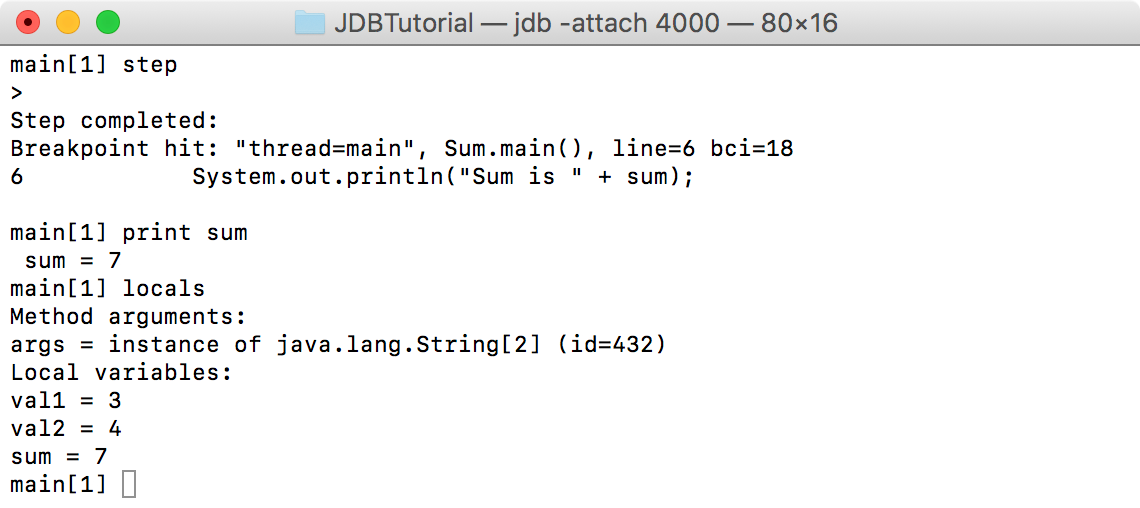
 Step one more time, and use
 locals command to see all local variables.
 Use
Use cont command to continue execution of the debugged application. Since there is no more lines need to be executed, application exits.
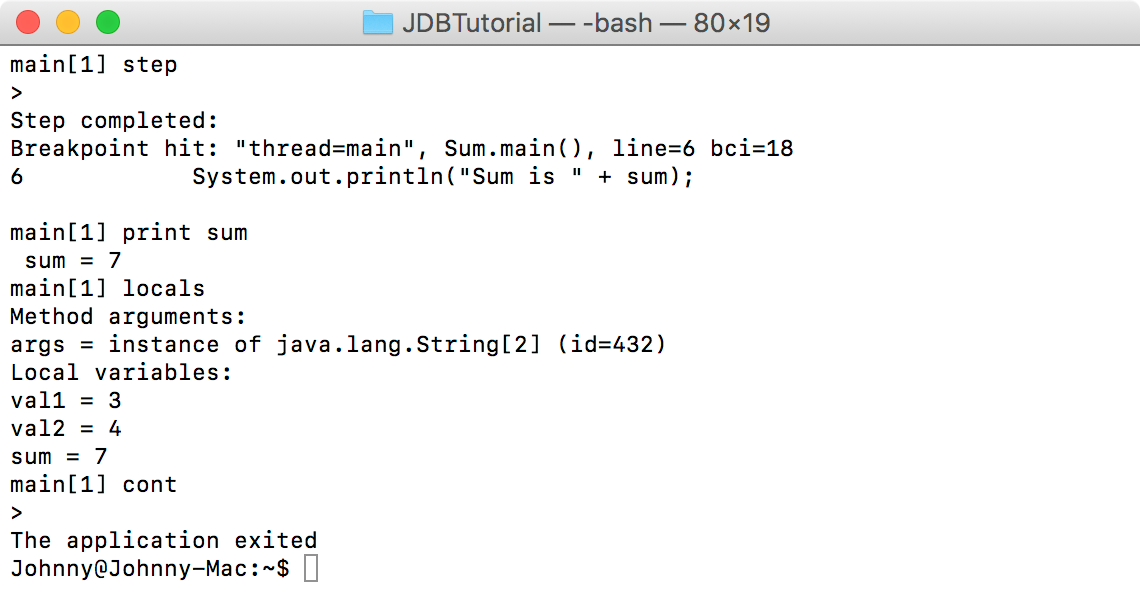 Switch to the first terminal, you see the result is printed out and debug process is stopped as well.